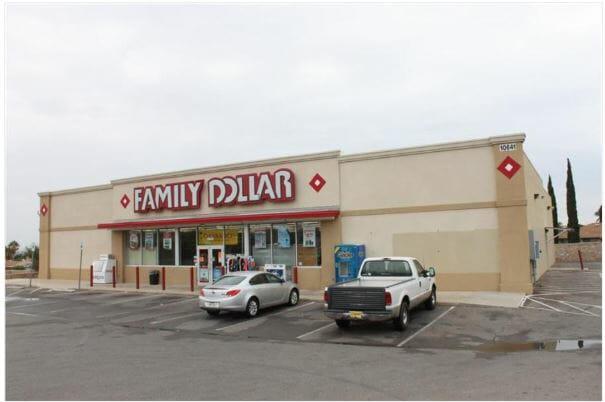
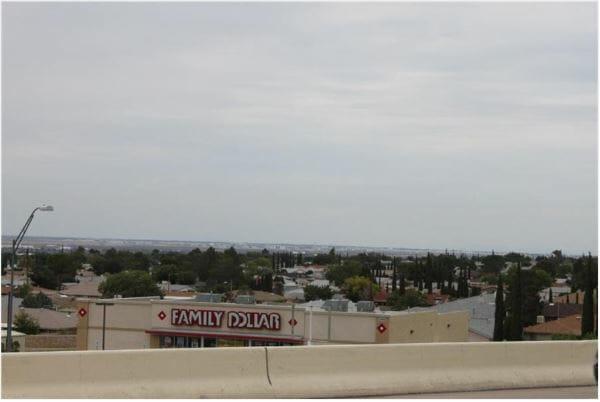
Situated at Kenworthy and Gateway North of Highway 54(North-South Freeway), in the City of El Paso, County of El Paso, State of Texas, and being that property running 261.93 feet along U.S. Highway 54 (North-South Freeway) and extending 226.62 feet in an easterly direction. Leased since it was build in 2004 to Family Dollar.Primary FeaturesCounty El PasoOff Market DateProperty Type CommercialSold DateSold PriceSubdivision Pleasant HillsZoning C3Financial DetailsApproximate Yearly Taxes 21111Exemptions UnknownLease Info NNNLease Terms SaleLeaseable Area Y/N yesNumber Of Tenants 1Packages IncludesSale Includes LeaseTax Year 2017Tenant Pays All UtilitiesAdditionalBest Use Distribution, Franchise, Retail, WarehouseEmpowerment Zone NoImproved YesMeasured By Appraiser CADProperty Building, Other ImprovementsSource Dimensions OtherVerification Actual RecordsExternal FeaturesConstruction Aluminum Siding, Brick Veneer, MetalDockFinance Considered Owner Will CarryHandicap Access YesLotLot SqFtMiscellaneous ExteriorDumpster Lease/Rented, Security LightingNumber Of Parking SpacesParking UnassignedProperty AccessUtilities All City, Electricity Available, Natural GasInterior FeaturesCooling RefrigeratedFinished Space yesHeating Natural GasRefrigeratedLocation InformationFlood Zone NoLocation Freestanding, Highway Frontage, Pad