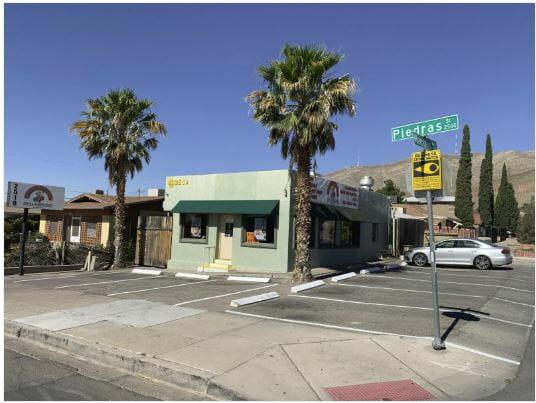
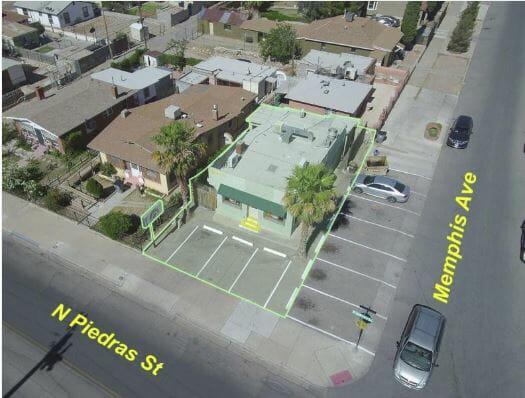
1-Mile | 3-Miles | 5-Miles | ||
---|---|---|---|---|
Total Population | 15,772 | 88,967 | 172,920 | |
Population Median Age | 39 | 38 | 37 | |
Population by Age | 0-9 Yrs | 1839 (11%) | 11406 (12%) | 24269 (14%) |
10-19 Yrs | 2060 (13%) | 11173 (12%) | 23367 (13%) | |
20-29 Yrs | 2420 (15%) | 16294 (18%) | 31592 (18%) | |
30-39 Yrs | 2051 (13%) | 11373 (12%) | 21462 (12%) | |
40-49 Yrs | 1805 (11%) | 9108 (10%) | 17783 (10%) | |
50-59 Yrs | 1958 (12%) | 10568 (11%) | 19832 (11%) | |
60-69 Yrs | 1533 (9%) | 8466 (9%) | 15675 (9%) | |
70+ Yrs | 2105 (13%) | 10579 (11%) | 18940 (10%) | |
Median HH Income | $33,564 | $32,672 | $33,247 | |
Total Household Income | < 24K | 2073 (35%) | 12896 (40%) | 24215 (39%) |
25-49K | 2051 (35%) | 9033 (28%) | 16979 (27%) | |
50-74K | 759 (13%) | 4341 (13%) | 8820 (14%) | |
75-99K | 449 (7%) | 2333 (7%) | 4378 (7%) | |
100-199K | 416 (7%) | 2701 (8%) | 5270 (8%) | |
200K+ | 56 (0%) | 560 (1%) | 1350 (2%) | |
Highest Education Level | No Diploma | 3406 | 17642 | 30553 |
Diploma or GED | 2204 | 12692 | 24375 | |
Some College | 2272 | 12141 | 22729 | |
Assoc. Degree | 978 | 4058 | 8036 | |
Bachelors Degree | 1299 | 7720 | 15514 | |
Higher Degree | 654 | 3851 | 8199 | |
Total Housing Units | 6,671 | 37,391 | 70,533 | |
--Owner-Occupied | 3,337 | 13,648 | 24,768 | |
--Renter-Occupied | 2,467 | 18,216 | 36,244 | |
Owner-Occupied Values | < 100K | 2006 | 7145 | 11965 |
100-199K | 1122 | 4682 | 8897 | |
200-299K | 122 | 979 | 2091 | |
300-399K | 68 | 555 | 1024 | |
400-499K | 10 | 141 | 393 | |
500K+ | 9 | 147 | 397 | |
Total Working Age Population | 12,502 | 70,547 | 134,553 | |
In Work Force | 7,210 | 41,601 | 79,765 | |
Not In Work Force | 5,292 | 28,946 | 54,789 | |
Workforce Employed | 6,520 | 34,810 | 66,275 | |
Workforce Unemployed | 514 | 2,930 | 5,919 | |
Civlian Workforce | 7,034 | 37,739 | 72,194 | |
Military Workforce | 176 | 3,861 | 7,571 | |
Total Households | 5,805 | 31,864 | 61,012 | |
Family Households | 3,656 | 19,554 | 37,795 | |
Non-Family Households | 2,149 | 12,310 | 23,217 | |
Married Couple | 2,208 | 12,107 | 23,598 | |
Other Family | 1,448 | 7,447 | 14,197 | |
Married w/Child | 916 | 4,765 | 9,886 | |
Single Male w/Child | 85 | 497 | 1,434 | |
Single Female w/Child | 311 | 2,502 | 5,093 |
Population Change Last Two Decades - Plus Projection
2000 | % | 2010 | % | 2020 | % | 2030 | |
---|---|---|---|---|---|---|---|
Texas | 20,851,820 | +21 | 25,145,561 | +18 | 29,677,668 | +18 | 34,894,452 |
El Paso County | 679,622 | +18 | 800,647 | +9 | 876,120 | +7 | 936,697 |
New Mexico | 1,819,046 | +13 | 2,059,179 | +6 | 2,187,183 | +6 | 2,308,475 |
Doña Ana County | 174,682 | +20 | 209,233 | +11 | 232,946 | +9 | 255,070 |
Total Working Age Population:
Total Households:
Total Working Age Population:
Total Households:
Total Working Age Population:
Total Households: