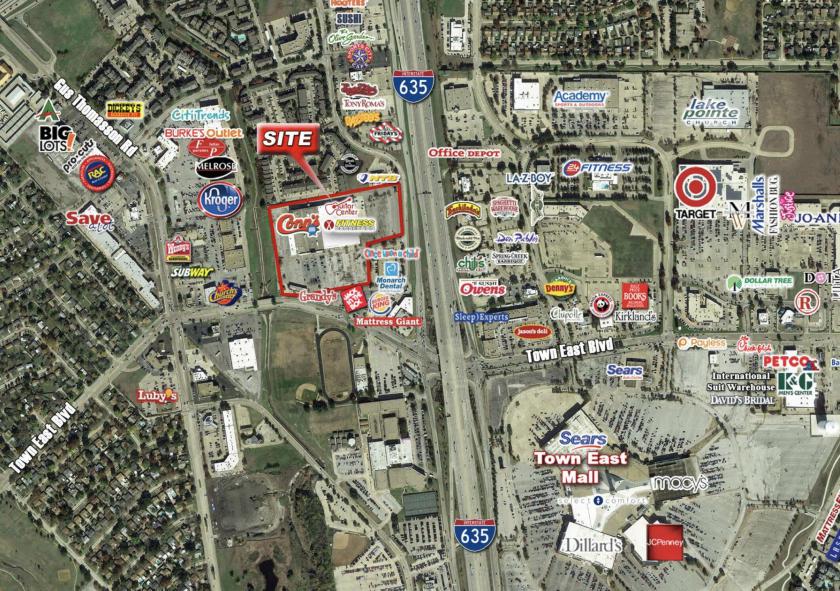
1-Mile | 3-Miles | 5-Miles | ||
---|---|---|---|---|
Total Population | 14,157 | 123,373 | 318,930 | |
Population Median Age | 34 | 34 | 34 | |
Population by Age | 0-9 Yrs | 1858 (13%) | 20469 (16%) | 51944 (16%) |
10-19 Yrs | 2399 (16%) | 19258 (15%) | 49956 (15%) | |
20-29 Yrs | 2154 (15%) | 19122 (15%) | 46521 (14%) | |
30-39 Yrs | 2135 (15%) | 15948 (12%) | 44380 (13%) | |
40-49 Yrs | 2093 (14%) | 15727 (12%) | 40389 (12%) | |
50-59 Yrs | 1463 (10%) | 13563 (10%) | 37214 (11%) | |
60-69 Yrs | 1216 (8%) | 11078 (8%) | 28102 (8%) | |
70+ Yrs | 840 (5%) | 8209 (6%) | 20424 (6%) | |
Median HH Income | $51,439 | $48,836 | $49,659 | |
Total Household Income | < 24K | 829 (16%) | 8559 (20%) | 22724 (21%) |
25-49K | 1585 (31%) | 12695 (30%) | 31097 (29%) | |
50-74K | 1141 (22%) | 9158 (22%) | 20839 (19%) | |
75-99K | 746 (14%) | 4663 (11%) | 13154 (12%) | |
100-199K | 610 (12%) | 5614 (13%) | 16018 (14%) | |
200K+ | 66 (1%) | 687 (1%) | 3080 (2%) | |
Highest Education Level | No Diploma | 1748 | 17148 | 46371 |
Diploma or GED | 2960 | 21858 | 52832 | |
Some College | 2082 | 17191 | 43771 | |
Assoc. Degree | 435 | 5225 | 12706 | |
Bachelors Degree | 1172 | 8889 | 25925 | |
Higher Degree | 526 | 3710 | 12338 | |
Total Housing Units | 5,474 | 44,548 | 115,576 | |
--Owner-Occupied | 1,895 | 19,701 | 57,220 | |
--Renter-Occupied | 3,082 | 21,675 | 49,691 | |
Owner-Occupied Values | < 100K | 559 | 6601 | 17239 |
100-199K | 1219 | 11018 | 28148 | |
200-299K | 73 | 1458 | 6877 | |
300-399K | 5 | 247 | 2641 | |
400-499K | 12 | 173 | 1130 | |
500K+ | 27 | 204 | 1185 | |
Total Working Age Population | 10,708 | 90,752 | 235,396 | |
In Work Force | 7,630 | 62,204 | 159,804 | |
Not In Work Force | 3,079 | 28,548 | 75,592 | |
Workforce Employed | 7,244 | 58,894 | 151,639 | |
Workforce Unemployed | 383 | 3,292 | 8,119 | |
Civlian Workforce | 7,627 | 62,186 | 159,758 | |
Military Workforce | 3 | 18 | 46 | |
Total Households | 4,977 | 41,376 | 106,911 | |
Family Households | 3,336 | 28,464 | 74,458 | |
Non-Family Households | 1,640 | 12,912 | 32,452 | |
Married Couple | 1,959 | 16,795 | 46,976 | |
Other Family | 1,377 | 11,669 | 27,482 | |
Married w/Child | 926 | 8,192 | 22,258 | |
Single Male w/Child | 196 | 1,640 | 3,384 | |
Single Female w/Child | 573 | 5,027 | 11,716 |
Population Change Last Two Decades - Plus Projection
2000 | % | 2010 | % | 2020 | % | 2030 | |
---|---|---|---|---|---|---|---|
Texas | 20,851,820 | +21 | 25,145,561 | +18 | 29,677,668 | +18 | 34,894,452 |
Dallas County | 2,218,899 | +7 | 2,368,139 | +15 | 2,734,111 | +14 | 3,106,298 |
Total Working Age Population:
Total Households:
Total Working Age Population:
Total Households:
Total Working Age Population:
Total Households: