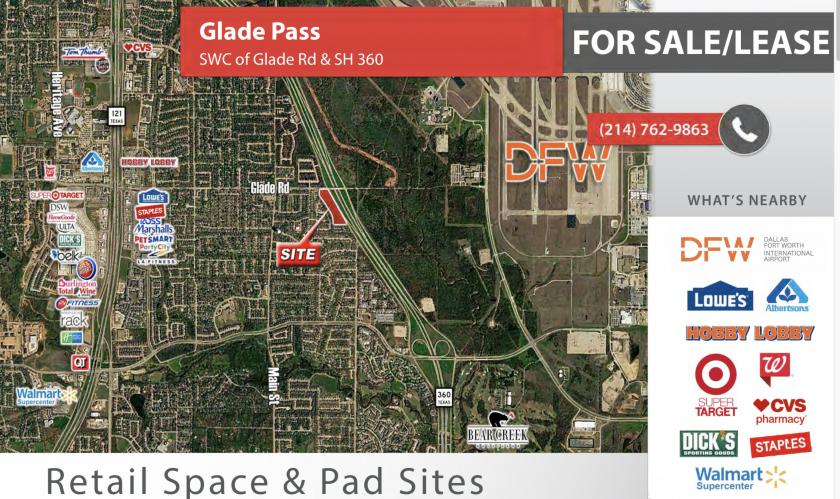
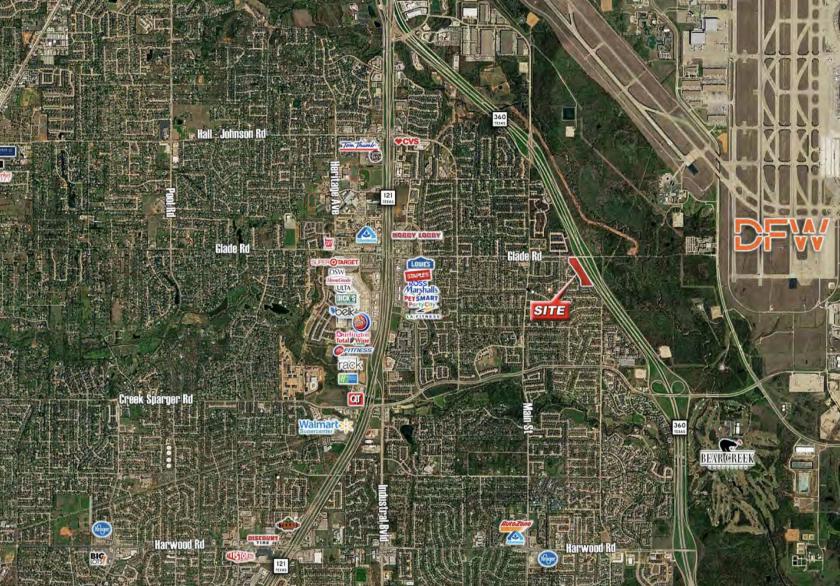
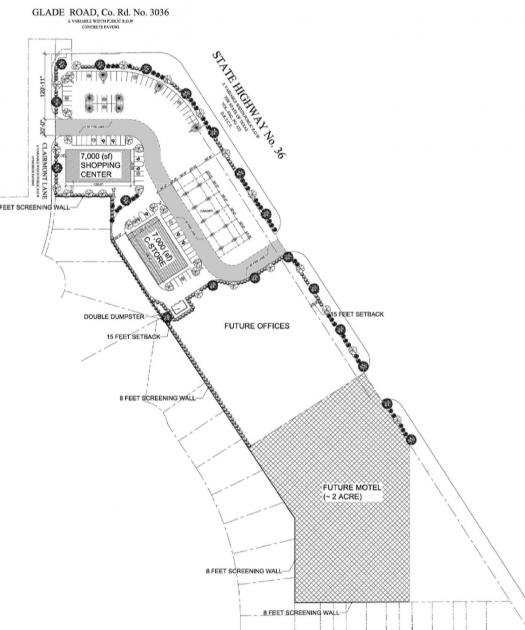
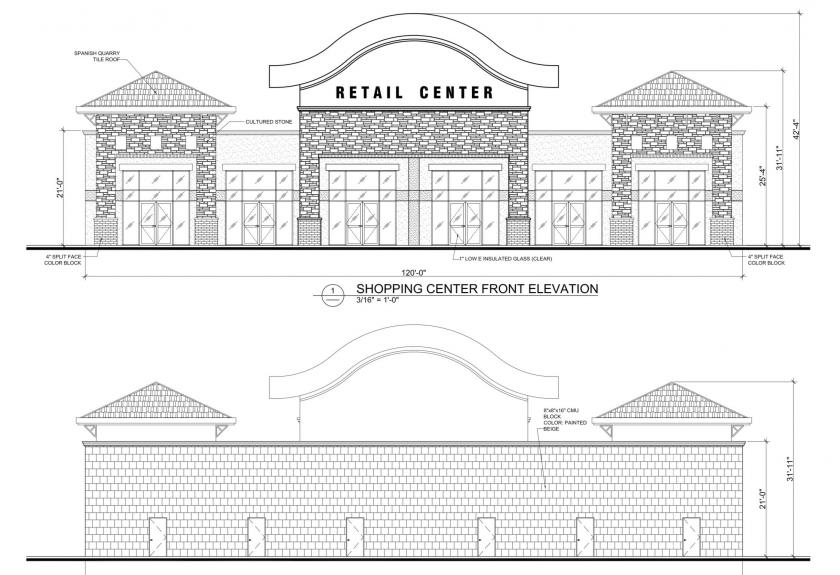
1-Mile | 3-Miles | 5-Miles | ||
---|---|---|---|---|
Total Population | 10,634 | 62,505 | 180,285 | |
Population Median Age | 39 | 38 | 37 | |
Population by Age | 0-9 Yrs | 1176 (11%) | 7723 (12%) | 23652 (13%) |
10-19 Yrs | 1425 (13%) | 7458 (11%) | 21945 (12%) | |
20-29 Yrs | 1047 (9%) | 7571 (12%) | 25678 (14%) | |
30-39 Yrs | 1415 (13%) | 9921 (15%) | 27043 (15%) | |
40-49 Yrs | 1695 (15%) | 8760 (14%) | 24860 (13%) | |
50-59 Yrs | 2057 (19%) | 9681 (15%) | 26501 (14%) | |
60-69 Yrs | 1125 (10%) | 7126 (11%) | 17987 (9%) | |
70+ Yrs | 693 (6%) | 4265 (6%) | 12619 (6%) | |
Median HH Income | $91,443 | $81,343 | $70,320 | |
Total Household Income | < 24K | 324 (7%) | 2194 (8%) | 8537 (11%) |
25-49K | 675 (16%) | 4571 (18%) | 15557 (21%) | |
50-74K | 754 (17%) | 4747 (19%) | 14042 (19%) | |
75-99K | 533 (12%) | 3372 (13%) | 8932 (12%) | |
100-199K | 1430 (33%) | 7137 (28%) | 17090 (23%) | |
200K+ | 491 (11%) | 2714 (10%) | 7179 (10%) | |
Highest Education Level | No Diploma | 432 | 2915 | 9489 |
Diploma or GED | 1139 | 7266 | 23560 | |
Some College | 1974 | 9928 | 28853 | |
Assoc. Degree | 673 | 3670 | 10462 | |
Bachelors Degree | 2097 | 13283 | 33901 | |
Higher Degree | 1224 | 7038 | 17707 | |
Total Housing Units | 4,459 | 26,202 | 76,117 | |
--Owner-Occupied | 2,680 | 13,778 | 34,700 | |
--Renter-Occupied | 1,527 | 10,956 | 36,637 | |
Owner-Occupied Values | < 100K | 181 | 1016 | 2575 |
100-199K | 913 | 3629 | 10116 | |
200-299K | 823 | 4128 | 8895 | |
300-399K | 497 | 2550 | 5443 | |
400-499K | 209 | 1480 | 3161 | |
500K+ | 57 | 975 | 4509 | |
Total Working Age Population | 8,579 | 49,730 | 142,988 | |
In Work Force | 6,386 | 36,689 | 105,364 | |
Not In Work Force | 2,193 | 13,041 | 37,624 | |
Workforce Employed | 6,239 | 35,317 | 101,317 | |
Workforce Unemployed | 148 | 1,372 | 3,998 | |
Civlian Workforce | 6,386 | 36,689 | 105,315 | |
Military Workforce | 0 | 0 | 49 | |
Total Households | 4,207 | 24,733 | 71,337 | |
Family Households | 2,781 | 16,397 | 45,020 | |
Non-Family Households | 1,425 | 8,337 | 26,316 | |
Married Couple | 2,157 | 12,629 | 33,049 | |
Other Family | 624 | 3,768 | 11,971 | |
Married w/Child | 865 | 5,120 | 14,184 | |
Single Male w/Child | 115 | 471 | 1,733 | |
Single Female w/Child | 280 | 1,677 | 5,288 |
Population Change Last Two Decades - Plus Projection
2000 | % | 2010 | % | 2020 | % | 2030 | |
---|---|---|---|---|---|---|---|
Texas | 20,851,820 | +21 | 25,145,561 | +18 | 29,677,668 | +18 | 34,894,452 |
Dallas County | 2,218,899 | +7 | 2,368,139 | +15 | 2,734,111 | +14 | 3,106,298 |
Tarrant County | 1,446,219 | +25 | 1,809,034 | +19 | 2,143,755 | +17 | 2,507,170 |
Total Working Age Population:
Total Households:
Total Working Age Population:
Total Households:
Total Working Age Population:
Total Households: