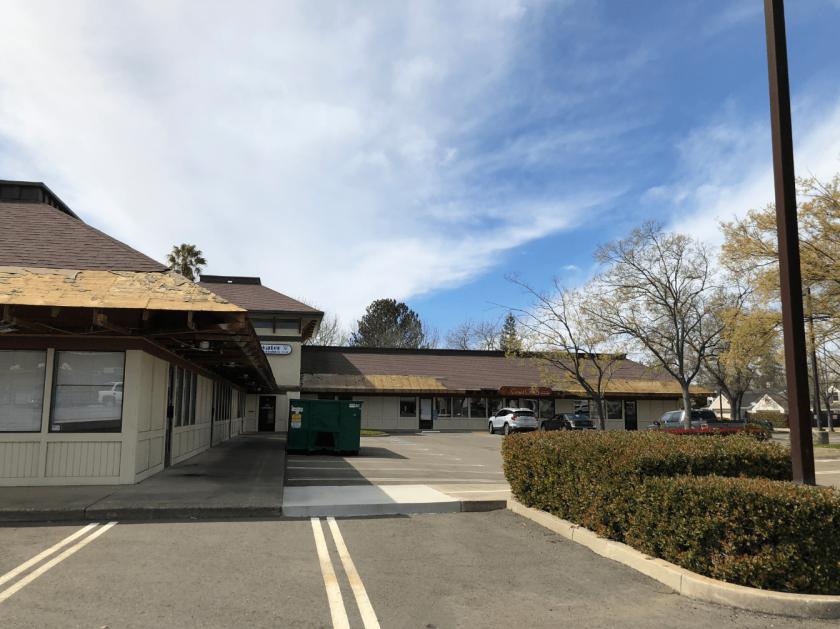
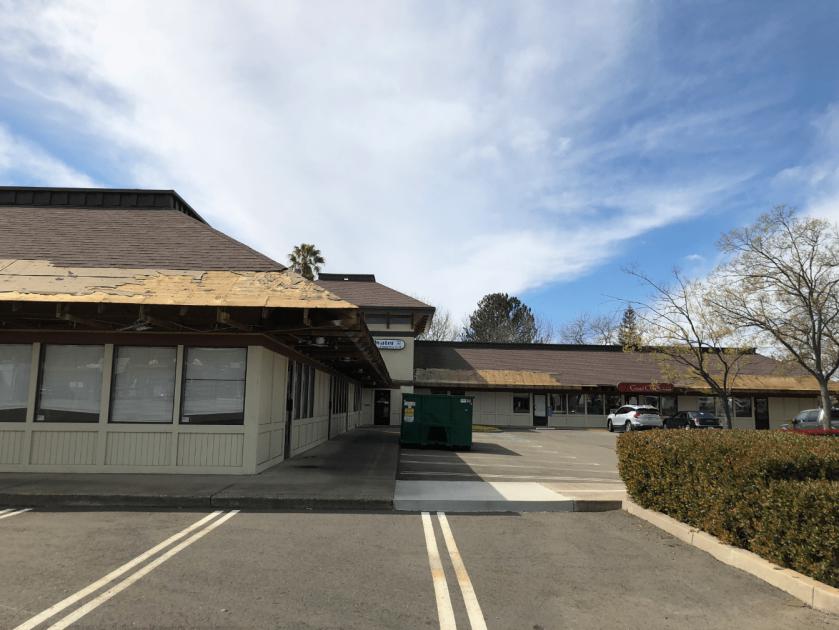
Office Space
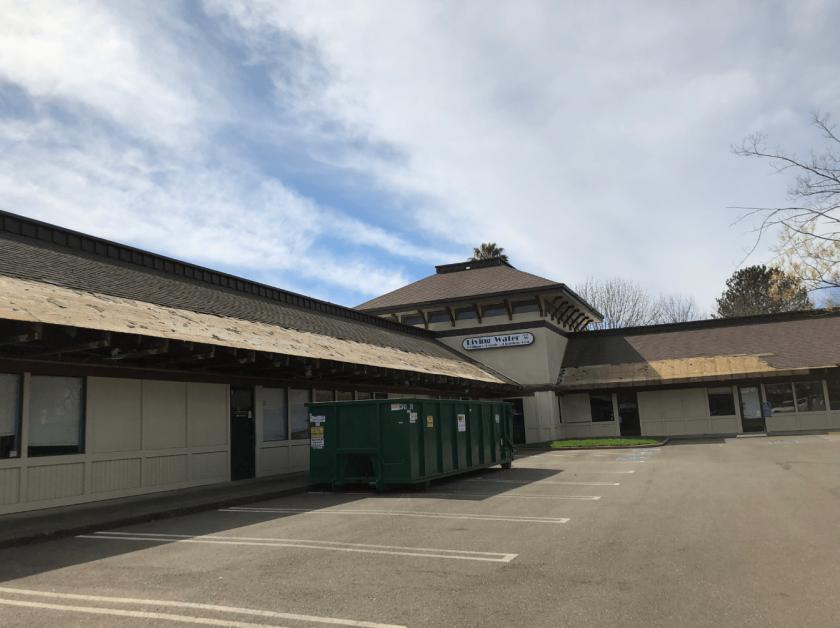
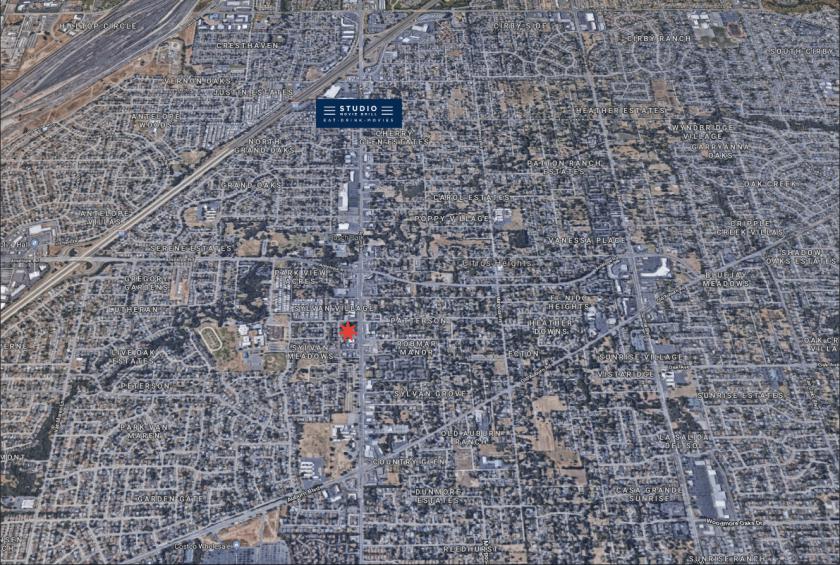
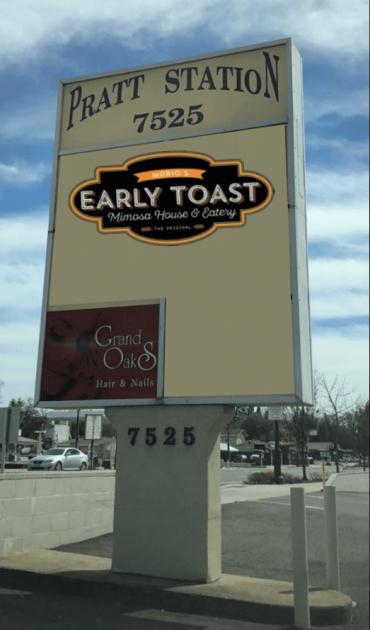
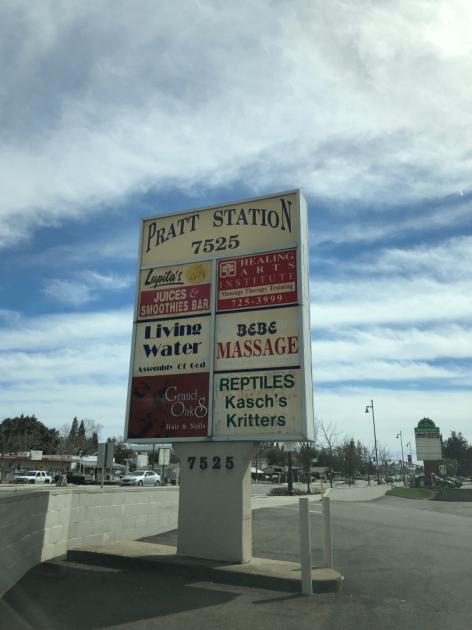
7525 Auburn Boulevard Citrus Heights, CA 95610
7525 Auburn Boulevard Citrus Heights, CA 95610
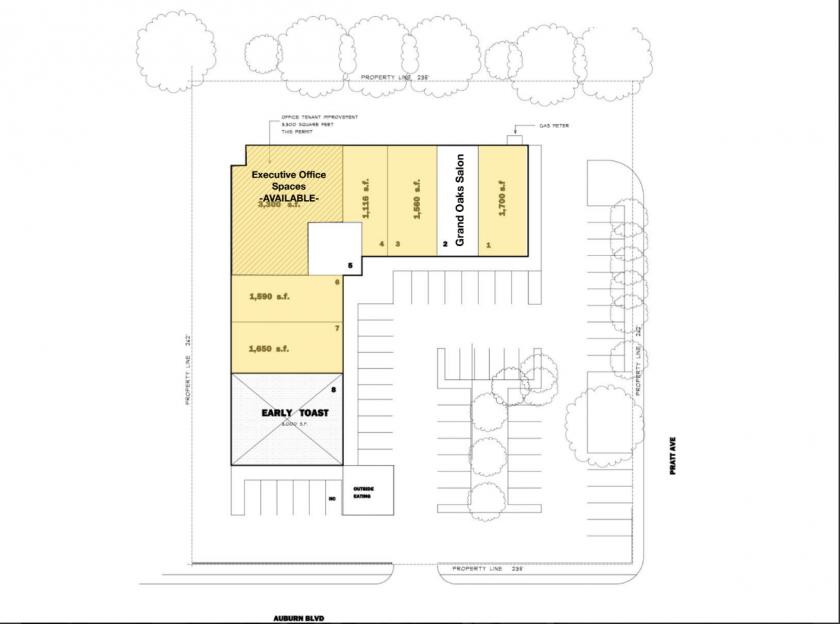
Details & Description
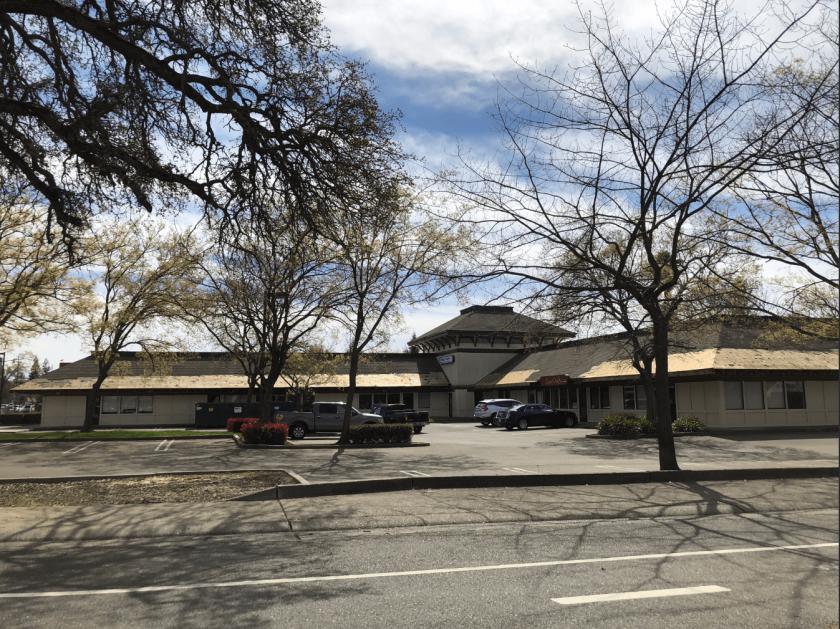
Additional Photos
Listing Agents

Nate Giwoff
O: 916-524-6097
nate@gqnorth.com
O: 916-524-6097
nate@gqnorth.com
While we strive to provide the most accurate information, all listing information, and demographic data, is provided by third-parties. As such, MyEListing will not be responsible for the accuracy of the information. It is strongly recommended that you verify all information with the listing agent, and any relevant agencies, prior to making any decisions.