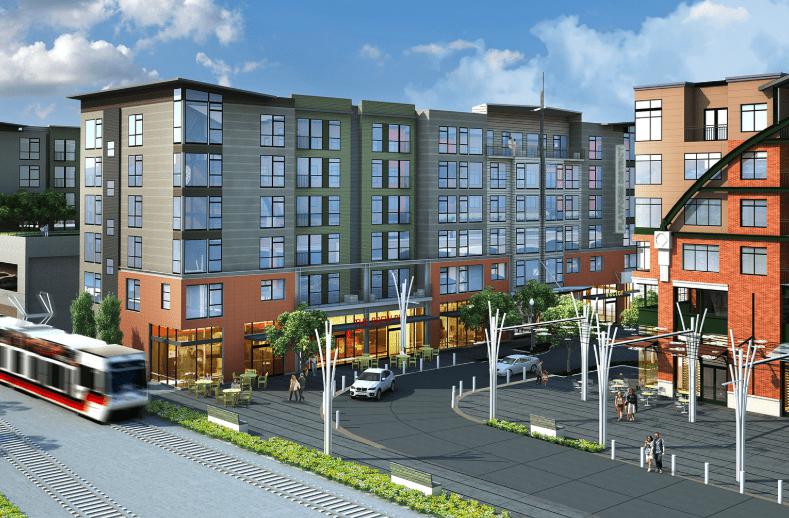
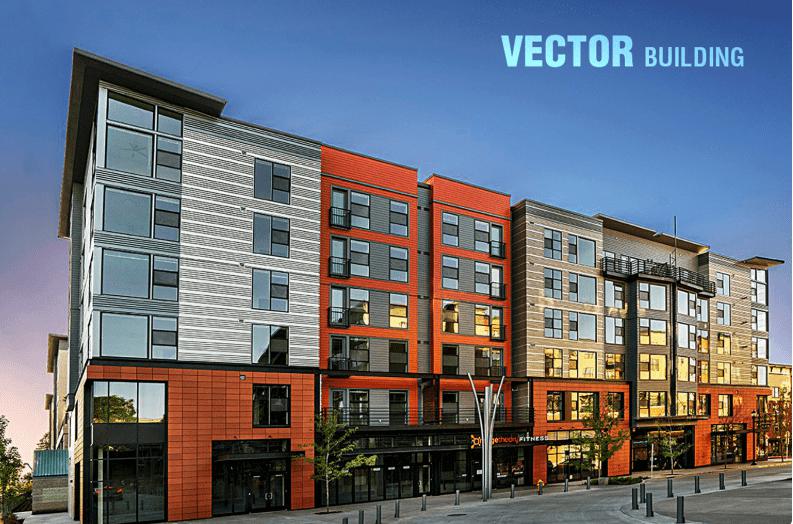
1-Mile | 3-Miles | 5-Miles | ||
---|---|---|---|---|
Total Population | 12,643 | 115,730 | 233,907 | |
Population Median Age | 33 | 35 | 35 | |
Population by Age | 0-9 Yrs | 1885 (14%) | 15715 (13%) | 33017 (14%) |
10-19 Yrs | 1325 (10%) | 13912 (12%) | 30200 (12%) | |
20-29 Yrs | 2290 (18%) | 18686 (16%) | 34282 (14%) | |
30-39 Yrs | 2684 (21%) | 20914 (18%) | 40248 (17%) | |
40-49 Yrs | 1917 (15%) | 16139 (13%) | 33307 (14%) | |
50-59 Yrs | 1154 (9%) | 13229 (11%) | 27289 (11%) | |
60-69 Yrs | 809 (6%) | 9665 (8%) | 20068 (8%) | |
70+ Yrs | 579 (4%) | 7470 (6%) | 15496 (6%) | |
Median HH Income | $102,249 | $78,264 | $79,832 | |
Total Household Income | < 24K | 396 (8%) | 4786 (11%) | 9281 (11%) |
25-49K | 480 (9%) | 7428 (17%) | 14609 (17%) | |
50-74K | 641 (13%) | 8363 (19%) | 15432 (18%) | |
75-99K | 872 (17%) | 7419 (17%) | 13705 (16%) | |
100-199K | 1865 (38%) | 12447 (28%) | 24516 (29%) | |
200K+ | 651 (13%) | 2648 (6%) | 6400 (7%) | |
Highest Education Level | No Diploma | 332 | 7299 | 14380 |
Diploma or GED | 892 | 14703 | 27777 | |
Some College | 1590 | 16565 | 32387 | |
Assoc. Degree | 621 | 7743 | 14657 | |
Bachelors Degree | 2693 | 19670 | 40997 | |
Higher Degree | 2603 | 12635 | 26087 | |
Total Housing Units | 5,182 | 45,195 | 87,886 | |
--Owner-Occupied | 2,657 | 22,660 | 48,467 | |
--Renter-Occupied | 2,249 | 20,431 | 35,477 | |
Owner-Occupied Values | < 100K | 30 | 947 | 1868 |
100-199K | 134 | 1926 | 3725 | |
200-299K | 571 | 7511 | 14157 | |
300-399K | 1077 | 7581 | 14853 | |
400-499K | 530 | 3172 | 7502 | |
500K+ | 316 | 1522 | 6362 | |
Total Working Age Population | 9,891 | 91,470 | 182,002 | |
In Work Force | 7,630 | 65,468 | 127,509 | |
Not In Work Force | 2,262 | 26,002 | 54,493 | |
Workforce Employed | 7,225 | 62,294 | 120,827 | |
Workforce Unemployed | 404 | 3,174 | 6,563 | |
Civlian Workforce | 7,630 | 65,468 | 127,390 | |
Military Workforce | 0 | 0 | 119 | |
Total Households | 4,906 | 43,091 | 83,944 | |
Family Households | 3,280 | 29,167 | 59,034 | |
Non-Family Households | 1,626 | 13,924 | 24,909 | |
Married Couple | 2,851 | 22,847 | 46,357 | |
Other Family | 429 | 6,320 | 12,677 | |
Married w/Child | 1,330 | 10,111 | 22,198 | |
Single Male w/Child | 56 | 814 | 1,866 | |
Single Female w/Child | 186 | 2,666 | 5,276 |
Population Change Last Two Decades - Plus Projection
2000 | % | 2010 | % | 2020 | % | 2030 | |
---|---|---|---|---|---|---|---|
Oregon | 3,421,399 | +12 | 3,831,074 | +11 | 4,264,810 | +11 | 4,727,438 |
Multnomah County | 660,486 | +11 | 735,334 | +12 | 822,675 | +10 | 906,904 |
Washington County | 445,342 | +19 | 529,710 | +17 | 619,337 | +16 | 718,633 |
Total Working Age Population:
Total Households:
Total Working Age Population:
Total Households:
Total Working Age Population:
Total Households: