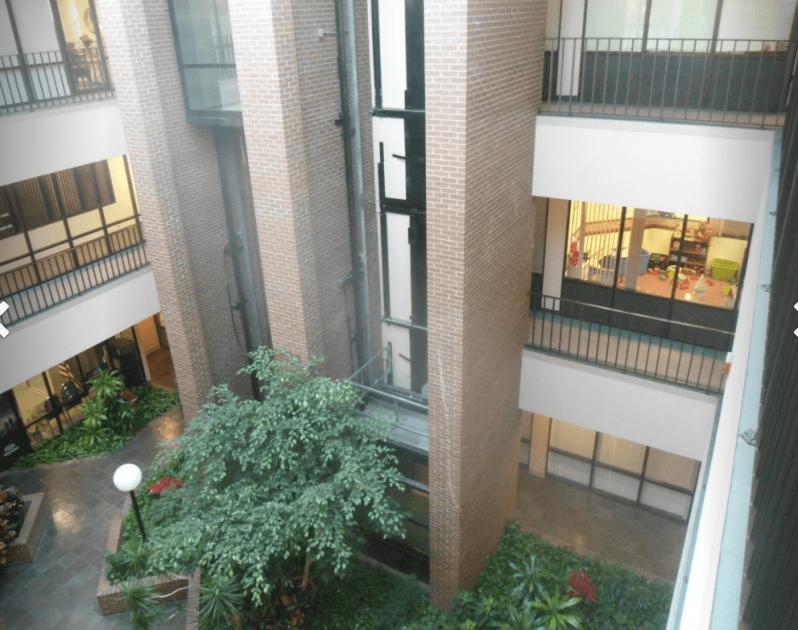
Property Subtypes:Executive Suites, Mixed Use, Flex Space, Office BuildingContiguous Space:190 - 2,983 SFTotal Available:11,245 SFBuilding Size (RSF):40,000 SFGross Land Area:2.21 AcresLease Rate:$4,020 - 57,273 (Annual)$18.60 - 31.25 PSF (Annual)Base Monthly Rent:$335 - 4,772Lease Types:Gross Lease, Modified GrossBuilding Name:ONE KILLEEN CENTERClass of Space:Class AUsable Size (USF):40,000 SFLast Updated:5/3/2019Overview / Comments"One Killeen Center" is the perfect address to showcase your business. This three story commercial office building has suites ranging in size from 100 s.f. and up complete with two elevators and beautiful atrium with skylight to provide plenty of natural light. Rates from $1.55 p.s.f. GROSS including utilities.Good parking with frontage on Central Texas Expressway and access to W.S.Young Drive.INCLUDES ALL UTILITIES except telephone and internet !!!9 Spaces AvailableSuite: 100-B574 SF$950 (Monthly) Gross LeaseSuite: 201-C1190 SF$335 (Monthly) Gross Lease,Modified GrossSuite: 201-D377 SF$760 (Monthly) Gross LeaseSuite: 2052,573 SF$1.55 - 1.65 PSF (Monthly) Gross LeaseSuite: 300-A240 SF$625 (Monthly) Gross LeaseSuite: 3021,001 SF$1.55 - 1.65 PSF (Monthly) Modified GrossSuite: 3032,301 SF$1.55 - 1.65 PSF (Monthly) Modified GrossSuite: 3101,006 SF$1.55 - 1.65 PSF (Monthly) Gross LeaseSuite: 3122,983 SF$1.55 - 1.60 PSF (Monthly) Modified GrossAdditional DetailsNearest MSA:Killeen-TempleCounty:BellTaxing Authority:Bell CadTax ID/APN:131862Zoning:B-3Market Type:MediumProperty Located Between:So. W.S.Young Dr. and Central Texas ExpwySide of Street:NorthRoad Type:HighwayProperty Visibility:ExcellentTransportation:Bus, TaxiHighway Access:Central Texas Expressway access road.Airports:Greater Killeen InternationalSite Description:Three story brick building with great visibility and great atmosphere, beautiful atrium and excellent parking.Area Description:Great location on the access road of Central Texas Expressway just west of W.S.Young.Total Number of Buildings:1Number of Stories:3Typical SF / Floor:20,000 SFYear Built:1985Year Renovated:2016Roof Type:FlatConstruction/Siding:BrickExterior Description:Brick and GlassParking Type:SurfaceParking Description:147 paved parking spaces on 3 sides of the building.Total Parking Spaces:147Passenger Elevators:2Sprinklers:WetHeat Type:ElectricityHeat Source:CentralAir Conditioning:Engineered SystemInternet Access:CableInterior Description:Beautiful interior common area with plants and trees in attrium next to the elevators.Zoning Description:B-3 local businessWater Service:MunicipalSewer Type:MunicipalEasements:UtilitiesDemographic StatisticsProximity:1 mile3 miles5 milesTotal Population:14,120100,602169,767Median Age:29.6328.2827.54Households:5,78638,77859,528