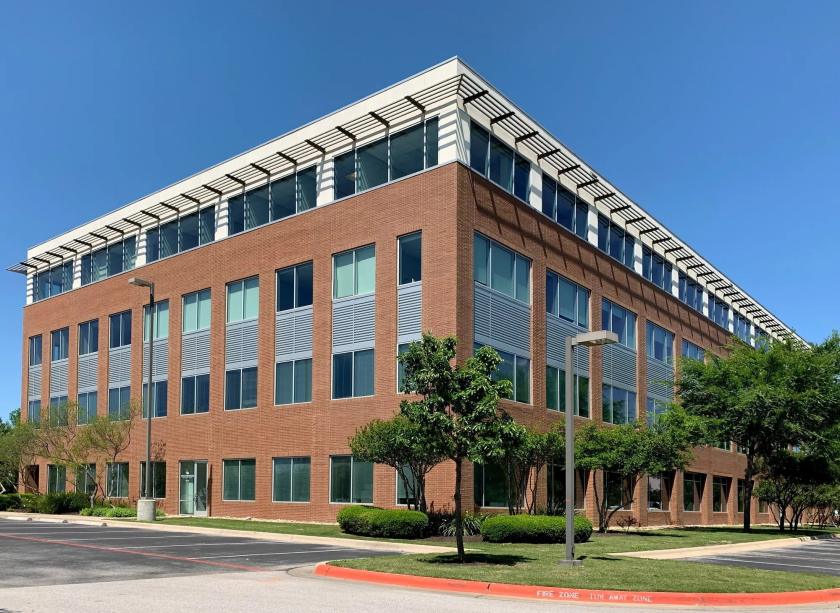
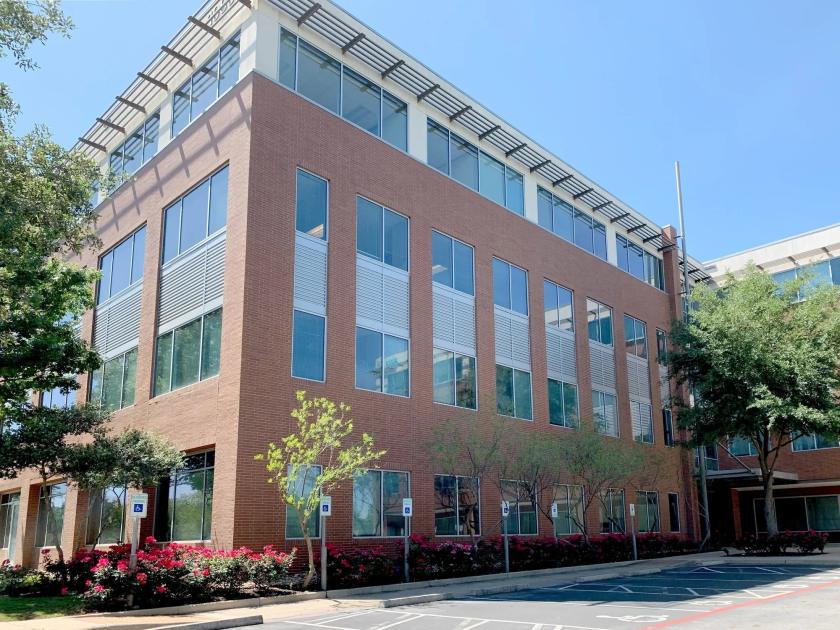
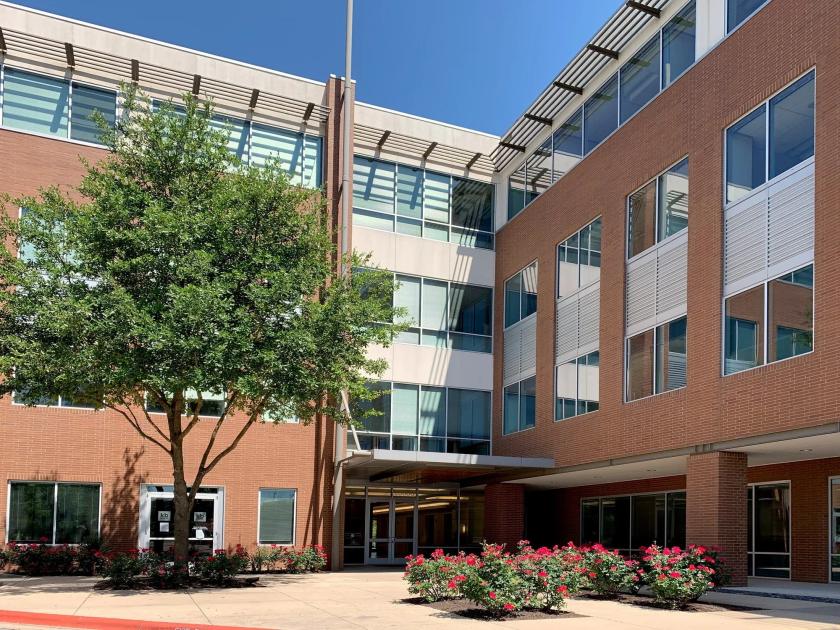
Office Space
10800 Pecan Park Boulevard Austin, TX 78750
10800 Pecan Park Boulevard Austin, TX 78750
Details & Description
Property Highlights
- • Easy access from Hwy 183 and SH-45
- • Parking ratio: 4.7:1,000
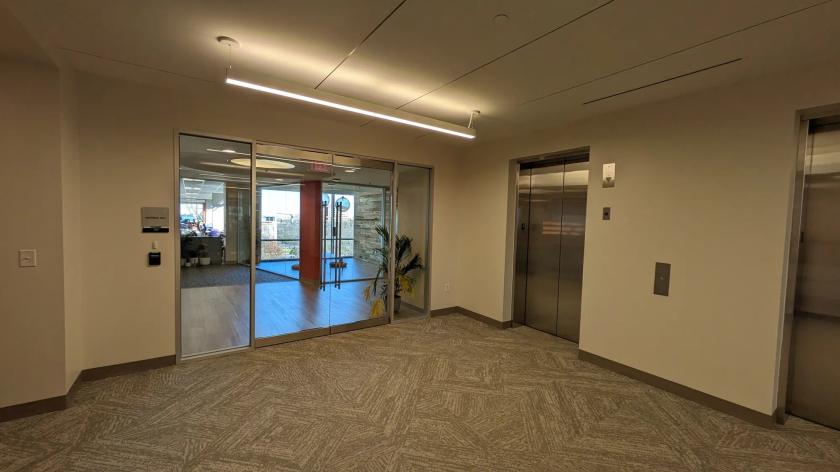
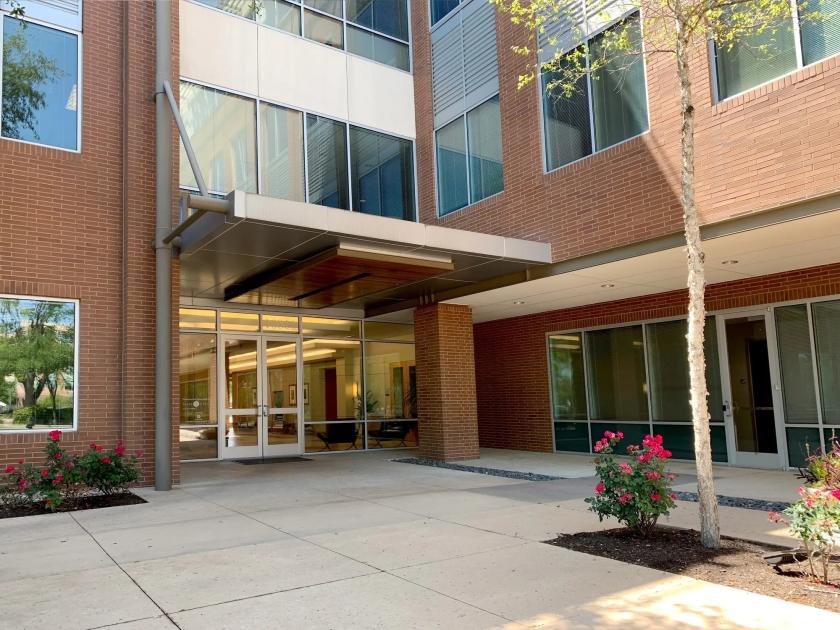
- • Outdoor courtyard
- • On-site fitness and shower facilities
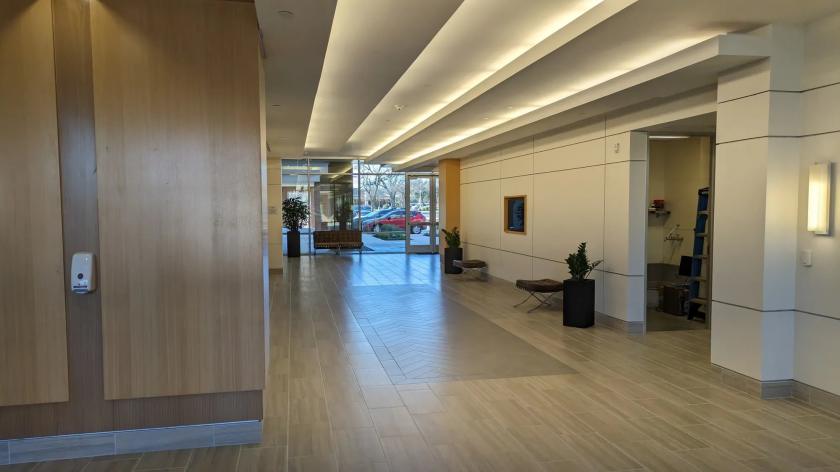
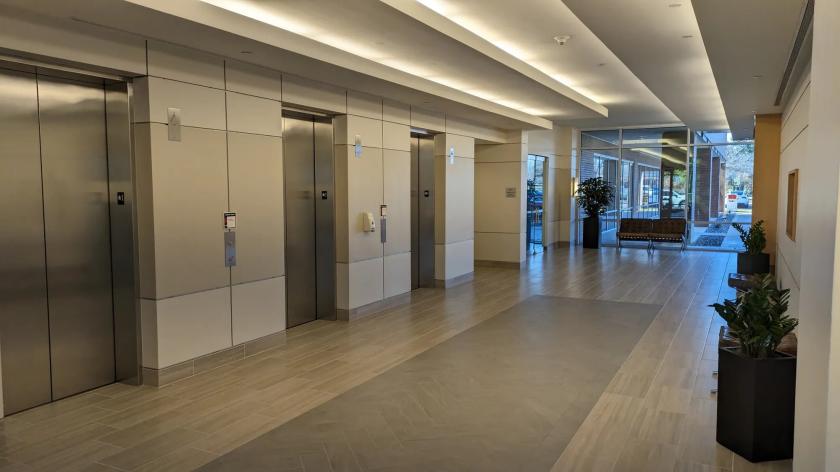
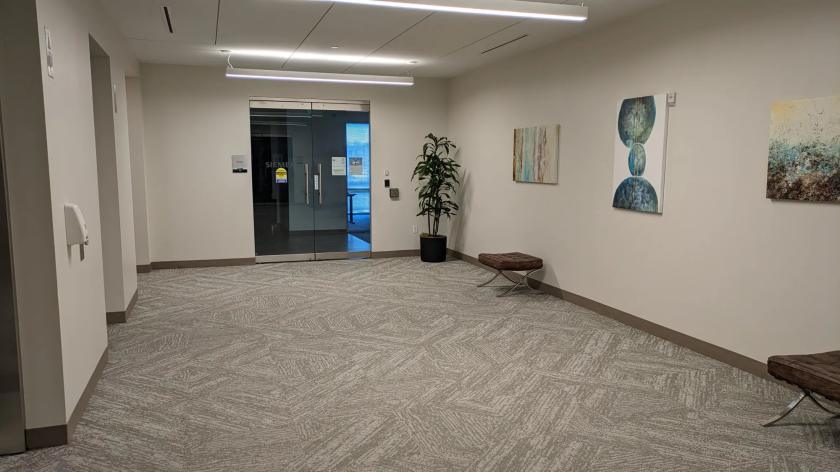
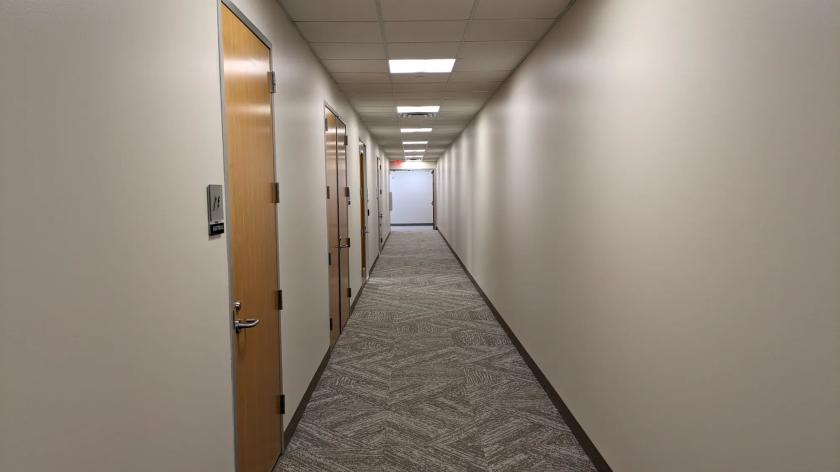
Additional Photos

Listing Agents

Robert Shore
O: 512-814-1812
robert@donquick.com
O: 512-814-1812
robert@donquick.com
While we strive to provide the most accurate information, all listing information, and demographic data, is provided by third-parties. As such, MyEListing will not be responsible for the accuracy of the information. It is strongly recommended that you verify all information with the listing agent, and any relevant agencies, prior to making any decisions.