Flex-Office-Warehouse
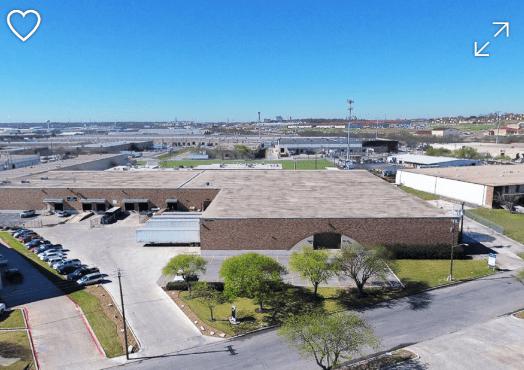
1901-1905 Shipman Drive San Antonio, TX 78219
1901-1905 Shipman Drive San Antonio, TX 78219
Details & Description
Listing Agents

Jordan Walker
O: 512-869-9777
walker@hpitx.com
O: 512-869-9777
walker@hpitx.com
While we strive to provide the most accurate information, all listing information, and demographic data, is provided by third-parties. As such, MyEListing will not be responsible for the accuracy of the information. It is strongly recommended that you verify all information with the listing agent, and any relevant agencies, prior to making any decisions.