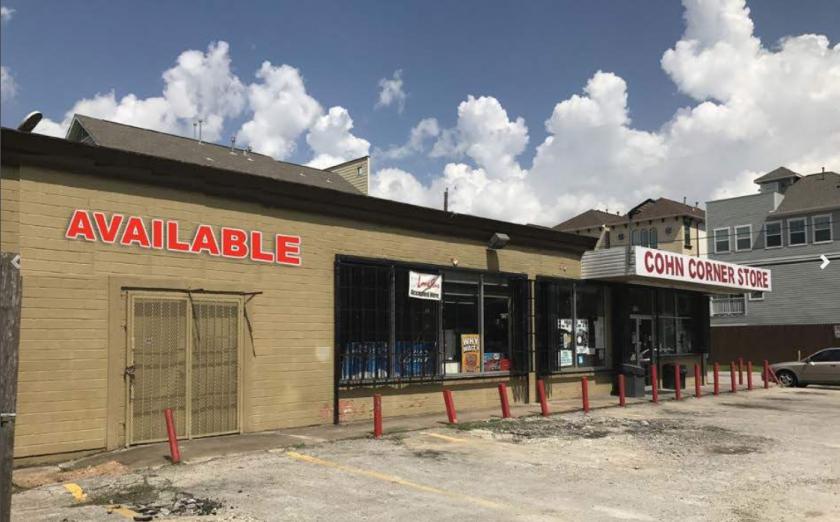
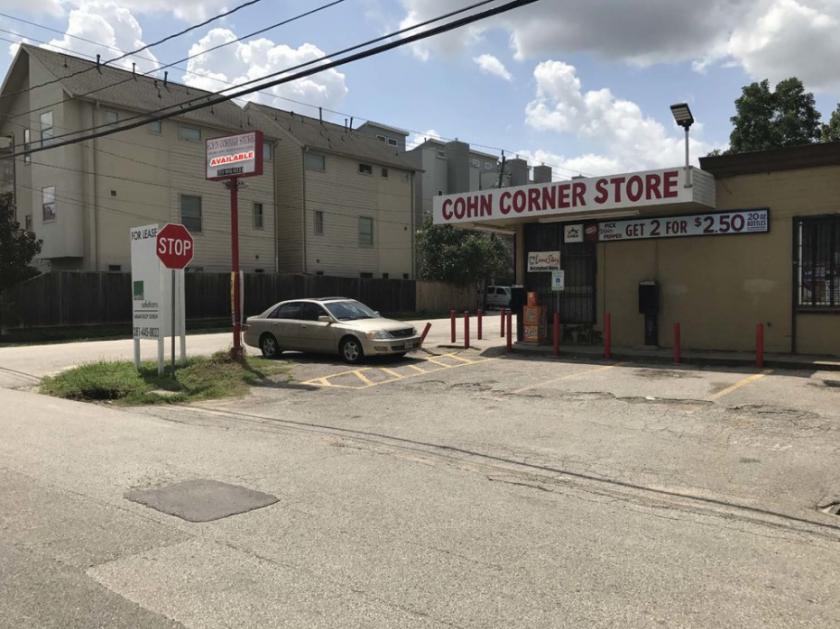
1-Mile | 3-Miles | 5-Miles | ||
---|---|---|---|---|
Total Population | 13,881 | 137,222 | 415,407 | |
Population Median Age | 36 | 39 | 38 | |
Population by Age | 0-9 Yrs | 1199 (8%) | 12689 (9%) | 45792 (11%) |
10-19 Yrs | 317 (2%) | 6862 (5%) | 33661 (8%) | |
20-29 Yrs | 3655 (26%) | 27948 (20%) | 77673 (18%) | |
30-39 Yrs | 3735 (26%) | 30411 (22%) | 80508 (19%) | |
40-49 Yrs | 2183 (15%) | 18597 (13%) | 54850 (13%) | |
50-59 Yrs | 1382 (9%) | 15696 (11%) | 50282 (12%) | |
60-69 Yrs | 1071 (7%) | 14636 (10%) | 40859 (9%) | |
70+ Yrs | 339 (2%) | 10384 (7%) | 31782 (7%) | |
Median HH Income | $128,052 | $108,990 | $85,144 | |
Total Household Income | < 24K | 377 (5%) | 8008 (11%) | 29851 (16%) |
25-49K | 801 (11%) | 8166 (11%) | 28747 (15%) | |
50-74K | 723 (10%) | 8497 (12%) | 26254 (14%) | |
75-99K | 705 (10%) | 7367 (10%) | 19111 (10%) | |
100-199K | 2460 (35%) | 19554 (28%) | 43511 (23%) | |
200K+ | 1962 (27%) | 17177 (24%) | 37742 (20%) | |
Highest Education Level | No Diploma | 545 | 5823 | 35082 |
Diploma or GED | 750 | 9706 | 40518 | |
Some College | 807 | 13712 | 41428 | |
Assoc. Degree | 600 | 4599 | 12726 | |
Bachelors Degree | 4798 | 42797 | 98712 | |
Higher Degree | 4072 | 33097 | 79722 | |
Total Housing Units | 7,739 | 77,536 | 211,609 | |
--Owner-Occupied | 4,606 | 36,298 | 88,736 | |
--Renter-Occupied | 2,422 | 32,470 | 96,481 | |
Owner-Occupied Values | < 100K | 75 | 1046 | 7536 |
100-199K | 130 | 2245 | 10025 | |
200-299K | 373 | 4194 | 11414 | |
300-399K | 1940 | 8082 | 14172 | |
400-499K | 1198 | 6527 | 11061 | |
500K+ | 890 | 14204 | 34528 | |
Total Working Age Population | 12,457 | 120,318 | 349,796 | |
In Work Force | 11,028 | 93,993 | 248,625 | |
Not In Work Force | 1,429 | 26,325 | 101,171 | |
Workforce Employed | 10,839 | 91,669 | 239,450 | |
Workforce Unemployed | 189 | 2,271 | 9,122 | |
Civlian Workforce | 11,028 | 93,940 | 248,572 | |
Military Workforce | 0 | 53 | 53 | |
Total Households | 7,028 | 68,769 | 185,216 | |
Family Households | 3,260 | 31,270 | 90,073 | |
Non-Family Households | 3,768 | 37,499 | 95,143 | |
Married Couple | 2,755 | 26,086 | 69,295 | |
Other Family | 505 | 5,184 | 20,778 | |
Married w/Child | 834 | 8,207 | 25,861 | |
Single Male w/Child | 85 | 739 | 2,680 | |
Single Female w/Child | 127 | 1,647 | 7,322 |
Population Change Last Two Decades - Plus Projection
2000 | % | 2010 | % | 2020 | % | 2030 | |
---|---|---|---|---|---|---|---|
Texas | 20,851,820 | +21 | 25,145,561 | +18 | 29,677,668 | +18 | 34,894,452 |
Harris County | 3,400,578 | +20 | 4,092,459 | +22 | 4,978,845 | +19 | 5,924,750 |
Total Working Age Population:
Total Households:
Total Working Age Population:
Total Households:
Total Working Age Population:
Total Households: