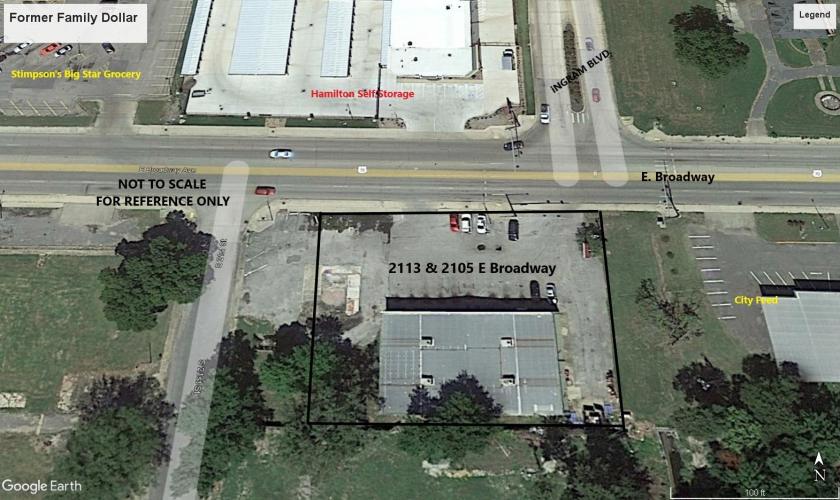
1-Mile | 3-Miles | 5-Miles | ||
---|---|---|---|---|
Total Population | 7,158 | 22,308 | 33,011 | |
Population Median Age | 35 | 36 | 36 | |
Population by Age | 0-9 Yrs | 1131 (15%) | 3961 (17%) | 5272 (15%) |
10-19 Yrs | 1090 (15%) | 2784 (12%) | 4639 (14%) | |
20-29 Yrs | 888 (12%) | 3331 (14%) | 4791 (14%) | |
30-39 Yrs | 1178 (16%) | 3110 (13%) | 4363 (13%) | |
40-49 Yrs | 582 (8%) | 2193 (9%) | 3757 (11%) | |
50-59 Yrs | 1159 (16%) | 2615 (11%) | 3844 (11%) | |
60-69 Yrs | 627 (8%) | 2256 (10%) | 3380 (10%) | |
70+ Yrs | 503 (7%) | 2058 (9%) | 2965 (8%) | |
Median HH Income | $24,449 | $33,339 | $40,213 | |
Total Household Income | < 24K | 1581 (51%) | 3706 (40%) | 4361 (32%) |
25-49K | 721 (23%) | 2352 (25%) | 3299 (24%) | |
50-74K | 358 (11%) | 1084 (11%) | 1764 (13%) | |
75-99K | 221 (7%) | 1057 (11%) | 1645 (12%) | |
100-199K | 181 (5%) | 861 (9%) | 1855 (14%) | |
200K+ | 7 (0%) | 120 (1%) | 293 (2%) | |
Highest Education Level | No Diploma | 1196 | 2616 | 3332 |
Diploma or GED | 1852 | 5238 | 7129 | |
Some College | 810 | 3487 | 5429 | |
Assoc. Degree | 278 | 846 | 1417 | |
Bachelors Degree | 219 | 1396 | 2456 | |
Higher Degree | 106 | 553 | 1121 | |
Total Housing Units | 3,746 | 10,259 | 14,771 | |
--Owner-Occupied | 1,196 | 4,310 | 7,074 | |
--Renter-Occupied | 1,872 | 4,870 | 6,143 | |
Owner-Occupied Values | < 100K | 1024 | 2460 | 2972 |
100-199K | 62 | 1482 | 3062 | |
200-299K | 101 | 282 | 805 | |
300-399K | 4 | 70 | 184 | |
400-499K | 0 | 5 | 27 | |
500K+ | 5 | 10 | 24 | |
Total Working Age Population | 5,343 | 16,632 | 24,936 | |
In Work Force | 2,956 | 9,929 | 15,533 | |
Not In Work Force | 2,387 | 6,703 | 9,404 | |
Workforce Employed | 2,657 | 8,902 | 14,115 | |
Workforce Unemployed | 299 | 1,027 | 1,417 | |
Civlian Workforce | 2,956 | 9,929 | 15,533 | |
Military Workforce | 0 | 0 | 0 | |
Total Households | 3,068 | 9,180 | 13,217 | |
Family Households | 1,949 | 5,466 | 8,177 | |
Non-Family Households | 1,119 | 3,714 | 5,040 | |
Married Couple | 605 | 2,638 | 4,555 | |
Other Family | 1,344 | 2,828 | 3,622 | |
Married w/Child | 236 | 1,015 | 1,851 | |
Single Male w/Child | 88 | 186 | 261 | |
Single Female w/Child | 503 | 1,371 | 1,749 |
Population Change Last Two Decades - Plus Projection
2000 | % | 2010 | % | 2020 | % | 2030 | |
---|---|---|---|---|---|---|---|
Arkansas | 2,673,400 | +9 | 2,915,918 | +5 | 3,072,430 | +6 | 3,271,344 |
Crittenden County | 50,866 | 0 | 50,902 | -2 | 49,762 | 0 | 49,762 |
Tennessee | 5,689,283 | +12 | 6,346,105 | +9 | 6,886,369 | +7 | 7,393,069 |
Shelby County | 897,472 | +3 | 927,644 | +1 | 940,109 | +2 | 956,754 |
Total Working Age Population:
Total Households:
Total Working Age Population:
Total Households:
Total Working Age Population:
Total Households: