Retail Space
6801 Warren Parkway Frisco, TX 75034
6801 Warren Parkway Frisco, TX 75034
Details & Description
Property Highlights
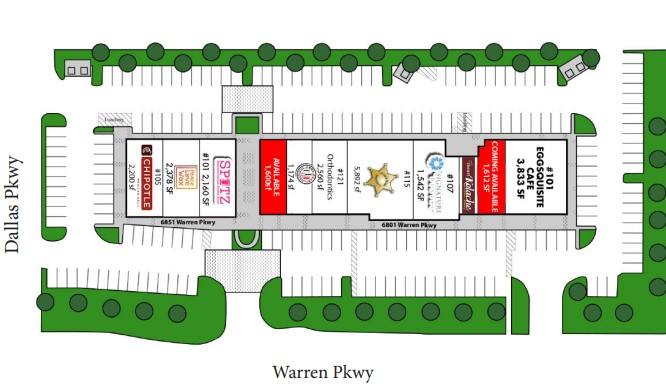
- • 1,600 SF Second Gen Restaurant Space Available
- • 1,613 SF Coming Available
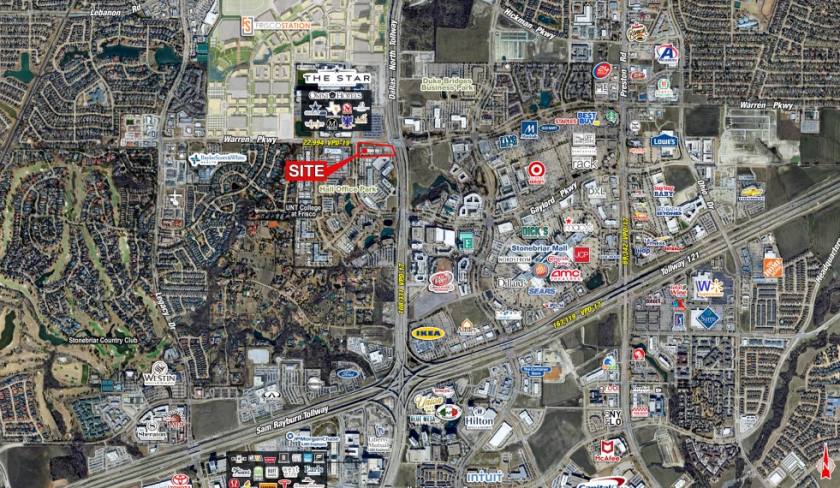
- • Traffic Counts: Dallas Pkwy 97,797 VPD
- • Traffic Counts: Warren Pkwy 18,478 VPD
Listing Agents

Thomas Glendenning
O: 214-960-4528
M: 214-960-4545
thomas@shopcompanies.com
O: 214-960-4528
M: 214-960-4545
thomas@shopcompanies.com

Jake Sherrington
O: 214-960-4545
M: 214-960-4623
jake@shopcompanies.com
O: 214-960-4545
M: 214-960-4623
jake@shopcompanies.com
While we strive to provide the most accurate information, all listing information, and demographic data, is provided by third-parties. As such, MyEListing will not be responsible for the accuracy of the information. It is strongly recommended that you verify all information with the listing agent, and any relevant agencies, prior to making any decisions.