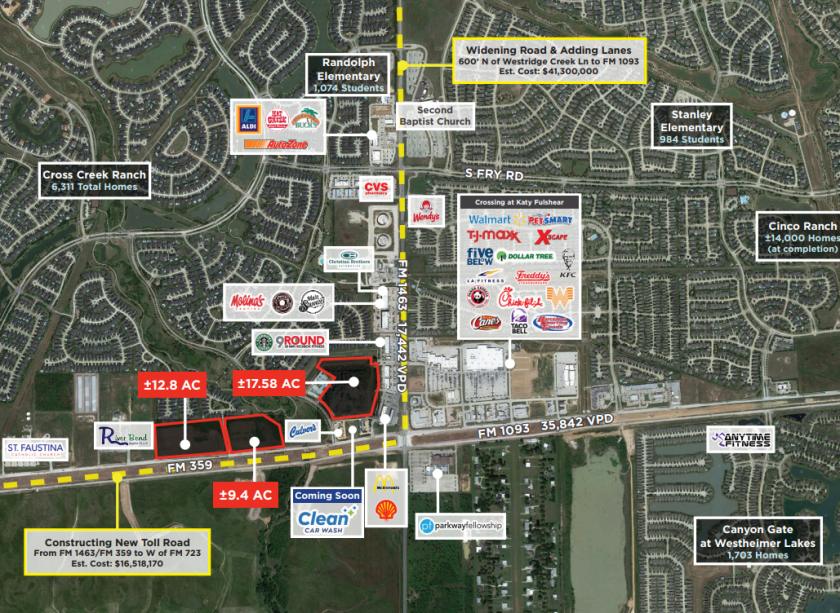
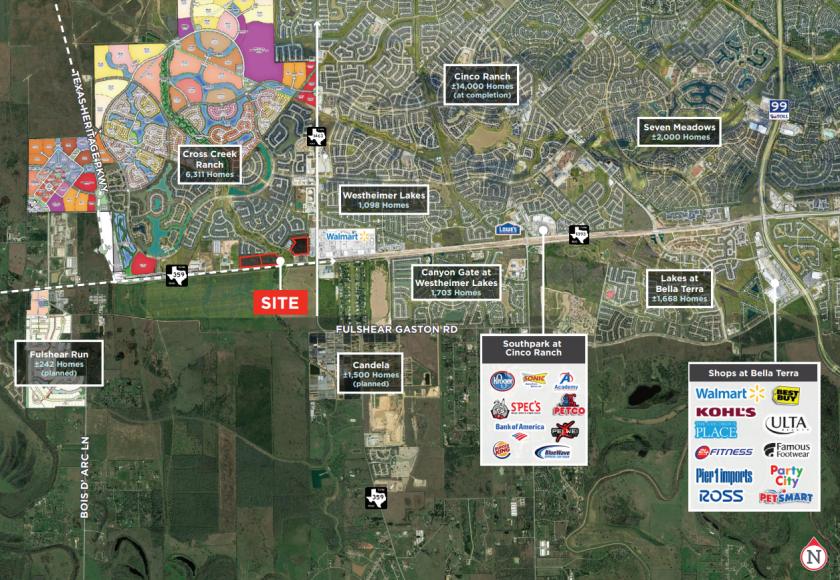
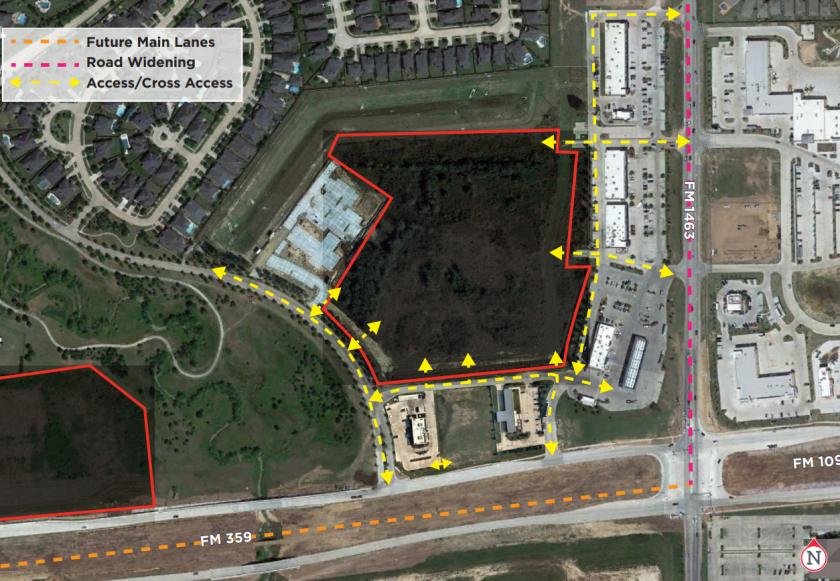
1-Mile | 3-Miles | 5-Miles | ||
---|---|---|---|---|
Total Population | 7,481 | 57,230 | 132,862 | |
Population Median Age | 33 | 34 | 34 | |
Population by Age | 0-9 Yrs | 943 (12%) | 8397 (14%) | 21026 (15%) |
10-19 Yrs | 1771 (23%) | 12661 (22%) | 26005 (19%) | |
20-29 Yrs | 592 (7%) | 2993 (5%) | 8462 (6%) | |
30-39 Yrs | 1044 (13%) | 8226 (14%) | 17409 (13%) | |
40-49 Yrs | 1671 (22%) | 11263 (19%) | 26126 (19%) | |
50-59 Yrs | 819 (10%) | 6689 (11%) | 17160 (12%) | |
60-69 Yrs | 408 (5%) | 4072 (7%) | 9735 (7%) | |
70+ Yrs | 233 (3%) | 2928 (5%) | 6939 (5%) | |
Median HH Income | $151,674 | $161,873 | $156,186 | |
Total Household Income | < 24K | 79 (3%) | 670 (3%) | 1944 (4%) |
25-49K | 243 (11%) | 846 (5%) | 2626 (6%) | |
50-74K | 60 (2%) | 862 (5%) | 2599 (6%) | |
75-99K | 111 (5%) | 898 (5%) | 2814 (6%) | |
100-199K | 1080 (50%) | 8287 (49%) | 17494 (43%) | |
200K+ | 572 (26%) | 5319 (31%) | 12975 (32%) | |
Highest Education Level | No Diploma | 307 | 1247 | 2733 |
Diploma or GED | 412 | 3572 | 7494 | |
Some College | 813 | 4910 | 12073 | |
Assoc. Degree | 186 | 1407 | 4282 | |
Bachelors Degree | 1713 | 12456 | 31307 | |
Higher Degree | 937 | 10810 | 23132 | |
Total Housing Units | 2,227 | 17,593 | 41,819 | |
--Owner-Occupied | 1,798 | 15,054 | 34,312 | |
--Renter-Occupied | 348 | 1,827 | 6,140 | |
Owner-Occupied Values | < 100K | 27 | 71 | 243 |
100-199K | 1 | 72 | 204 | |
200-299K | 256 | 1622 | 4361 | |
300-399K | 523 | 4631 | 9390 | |
400-499K | 412 | 4200 | 8920 | |
500K+ | 579 | 4458 | 11194 | |
Total Working Age Population | 5,464 | 40,317 | 93,811 | |
In Work Force | 3,406 | 25,457 | 59,629 | |
Not In Work Force | 2,058 | 14,861 | 34,182 | |
Workforce Employed | 3,271 | 24,375 | 56,946 | |
Workforce Unemployed | 135 | 1,082 | 2,683 | |
Civlian Workforce | 3,406 | 25,457 | 59,629 | |
Military Workforce | 0 | 0 | 0 | |
Total Households | 2,146 | 16,881 | 40,452 | |
Family Households | 1,983 | 15,517 | 36,681 | |
Non-Family Households | 163 | 1,364 | 3,771 | |
Married Couple | 1,848 | 14,296 | 33,506 | |
Other Family | 136 | 1,221 | 3,175 | |
Married w/Child | 1,315 | 9,888 | 22,041 | |
Single Male w/Child | 55 | 243 | 454 | |
Single Female w/Child | 32 | 664 | 1,702 |
Population Change Last Two Decades - Plus Projection
2000 | % | 2010 | % | 2020 | % | 2030 | |
---|---|---|---|---|---|---|---|
Texas | 20,851,820 | +21 | 25,145,561 | +16 | 29,145,505 | +13 | 32,912,882 |
Fort Bend County | 354,452 | +65 | 585,375 | +41 | 822,779 | +29 | 1,059,889 |
Total Working Age Population:
Total Households:
Total Working Age Population:
Total Households:
Total Working Age Population:
Total Households: