Commercial Land
2520 West Jefferson Street Grand Prairie, TX 75051
2520 West Jefferson Street Grand Prairie, TX 75051
Details & Description
Property Highlights
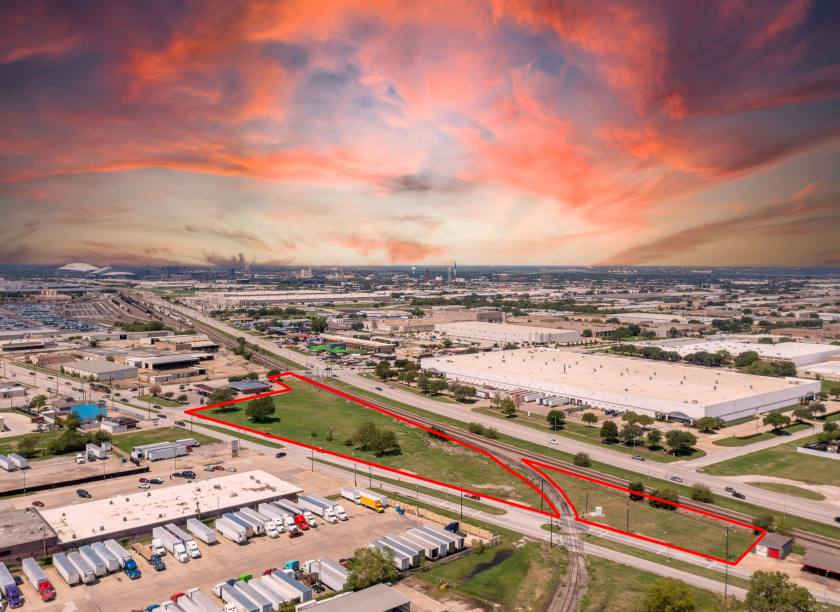
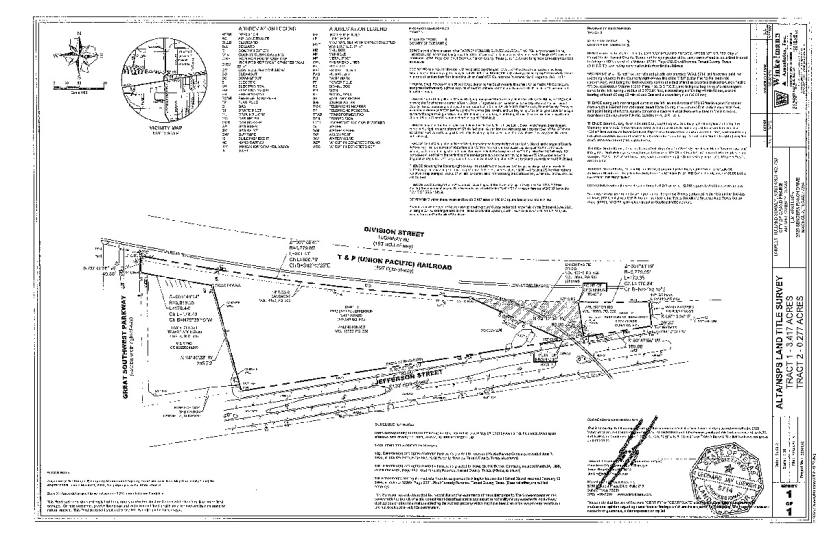
- • 3.7 AC of Commercial Land
- • Zoning Allows for Warehouse/Flex Development
- • Indoor and Outdoor Storage Allowed
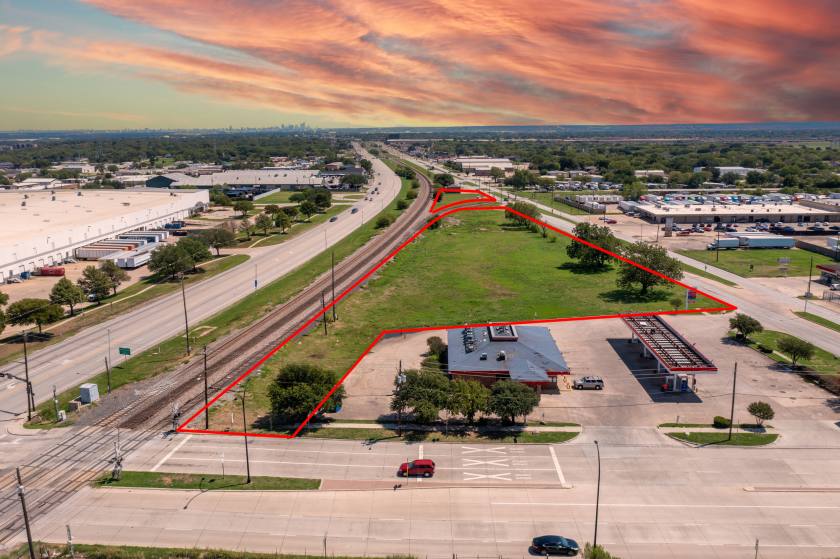
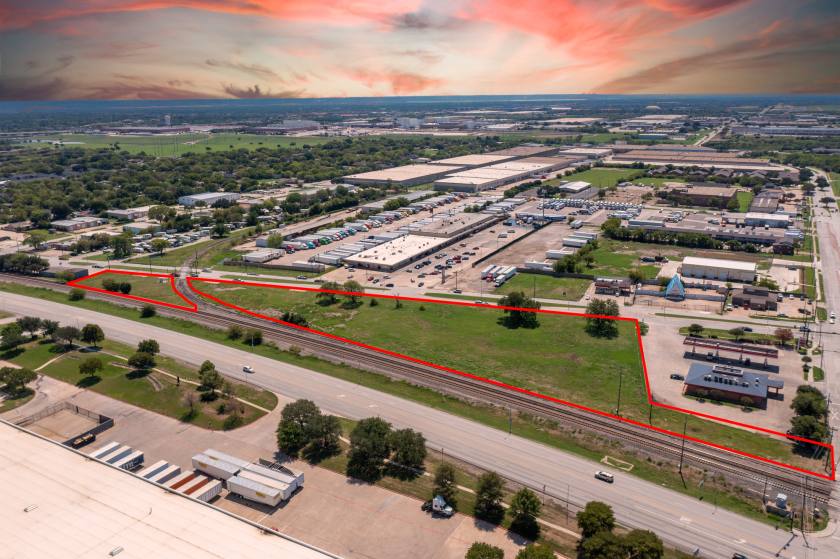
- • High Visibility on Major Thoroughfare
- • Quick Access to Hwy 360, PGBT, and I-30
Additional Photos
Listing Agents

David Dunn
O: 817-640-9964
M: 817-829-2828
david.dunn@svn.com
O: 817-640-9964
M: 817-829-2828
david.dunn@svn.com
While we strive to provide the most accurate information, all listing information, and demographic data, is provided by third-parties. As such, MyEListing will not be responsible for the accuracy of the information. It is strongly recommended that you verify all information with the listing agent, and any relevant agencies, prior to making any decisions.


