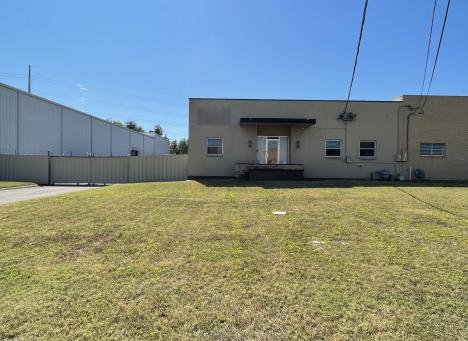
Industrial Properties
8815 Diplomacy Row Dallas, TX 75247
8815 Diplomacy Row Dallas, TX 75247
Details & Description
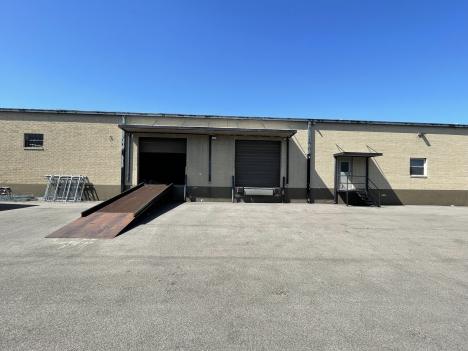
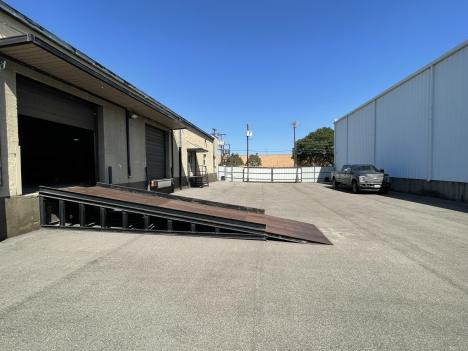
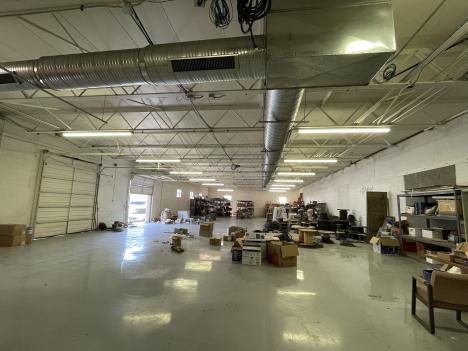
Property Highlights
- • Office: 1,000 SF
- • Secure Truck Court
- • HVAC Warehouse
- • 2 Dock High Doors
- • Side Loader
- • 12’ Clear Height
Additional Photos
Listing Agents

Tyler Tillery
O: 214-256-7140
M: 940-389-6884
ttillery@robertlynn.com
O: 214-256-7140
M: 940-389-6884
ttillery@robertlynn.com
While we strive to provide the most accurate information, all listing information, and demographic data, is provided by third-parties. As such, MyEListing will not be responsible for the accuracy of the information. It is strongly recommended that you verify all information with the listing agent, and any relevant agencies, prior to making any decisions.


