Industrial Properties
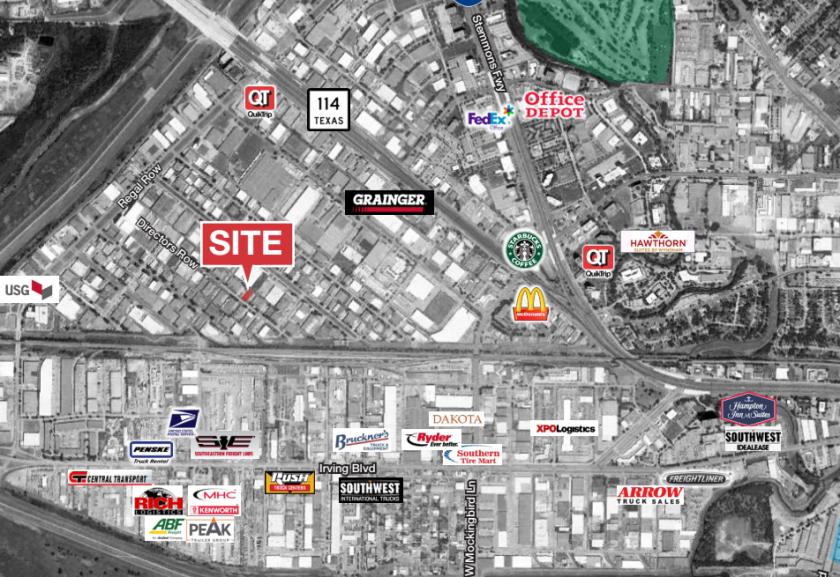
8708 Directors Row Dallas, TX 75247
8708 Directors Row Dallas, TX 75247
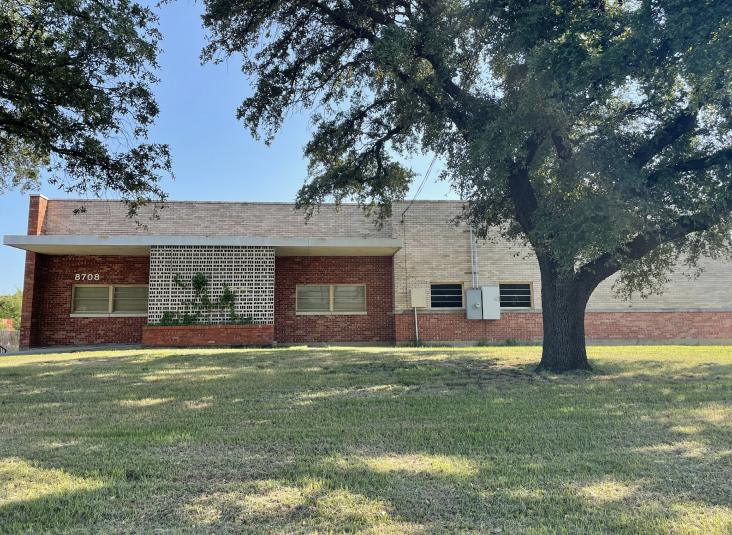
Details & Description
Property Highlights
- • Office: 1,200 SF
- • Fenced Outside Storage
- • Two (2) Dock High Doors
- • Utilities: Gas, Heating, Lighting, Sewer, Water
- • 25 Parking Spaces
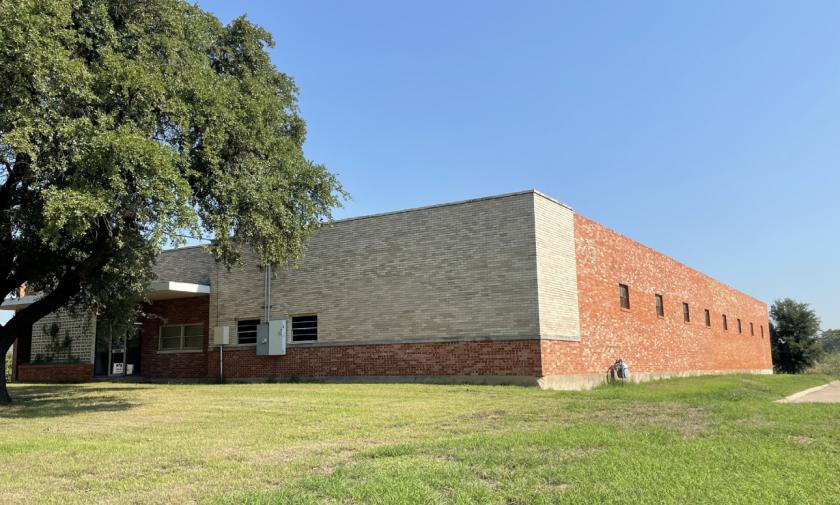
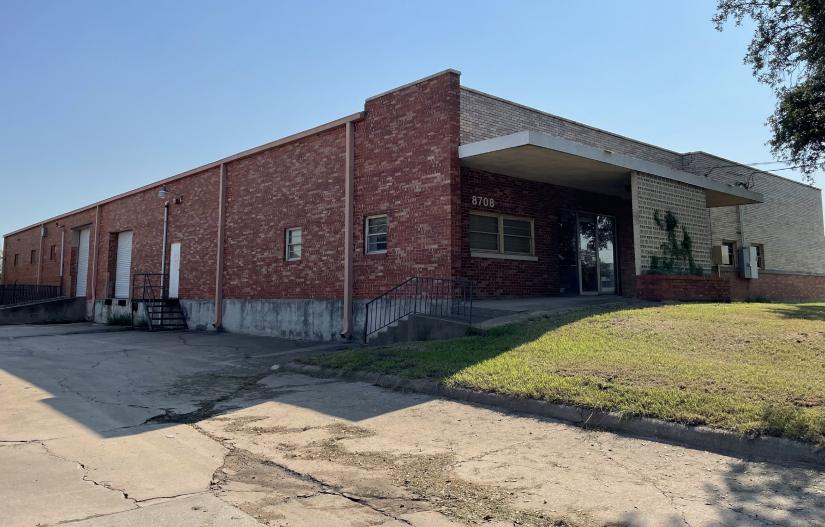
Additional Photos
Listing Agents

Chase Miller
O: 214-256-7131
M: 214-770-5495
cmiller@nairl.com
O: 214-256-7131
M: 214-770-5495
cmiller@nairl.com
Robert Blankinship
O: 214-256-7115
M: 214-500-6326
rblankinship@nairl.com
O: 214-256-7115
M: 214-500-6326
rblankinship@nairl.com
While we strive to provide the most accurate information, all listing information, and demographic data, is provided by third-parties. As such, MyEListing will not be responsible for the accuracy of the information. It is strongly recommended that you verify all information with the listing agent, and any relevant agencies, prior to making any decisions.


