Industrial Properties
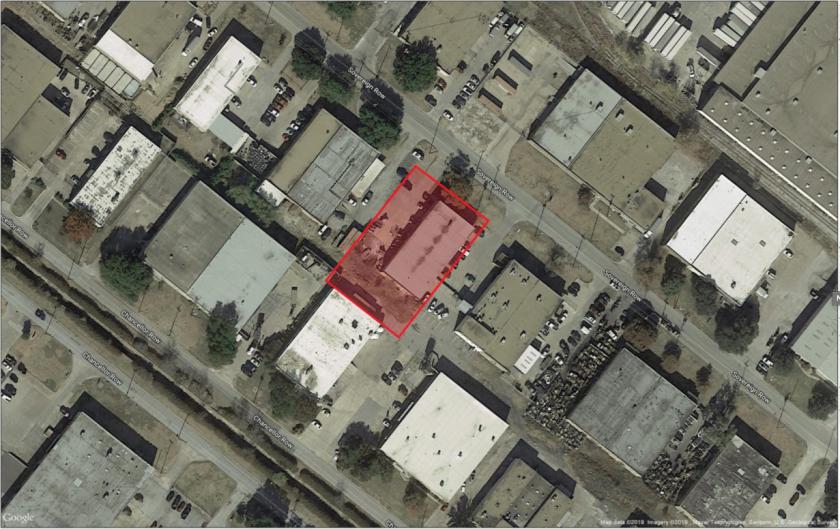
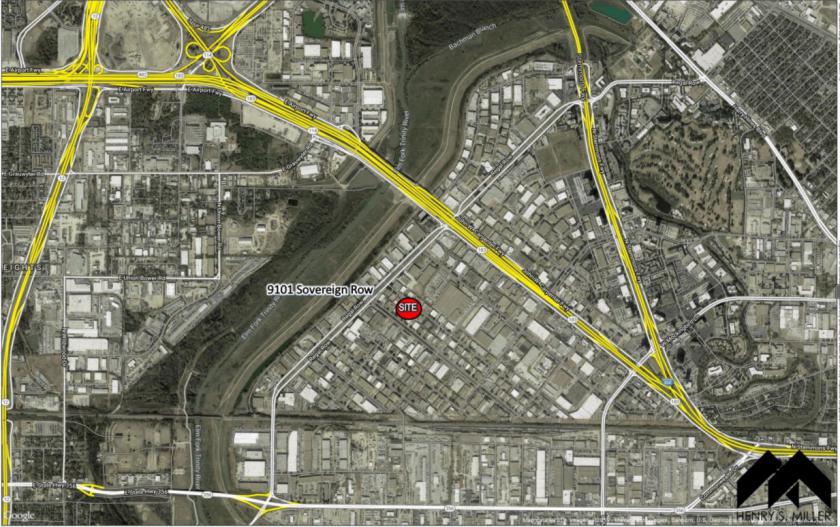
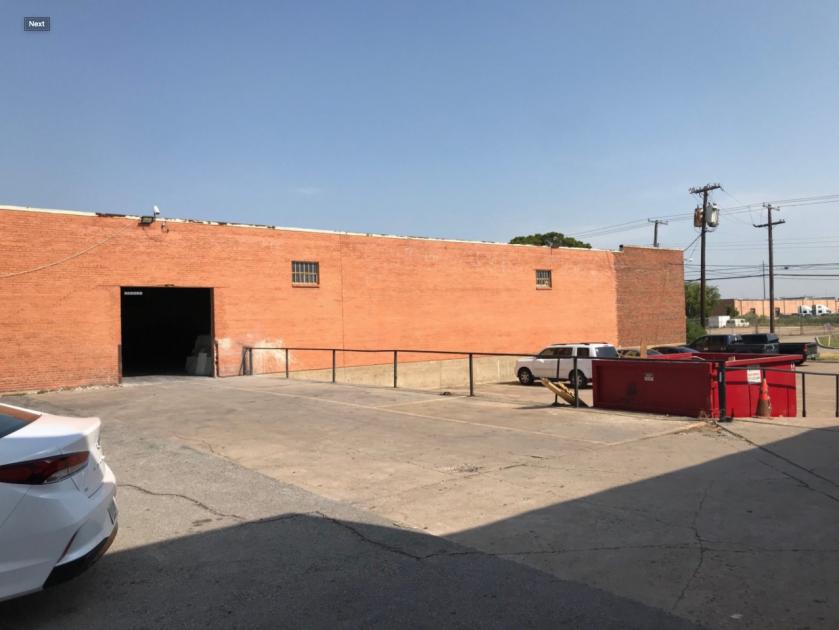
9101 Sovereign Row Dallas, TX 75247
9101 Sovereign Row Dallas, TX 75247
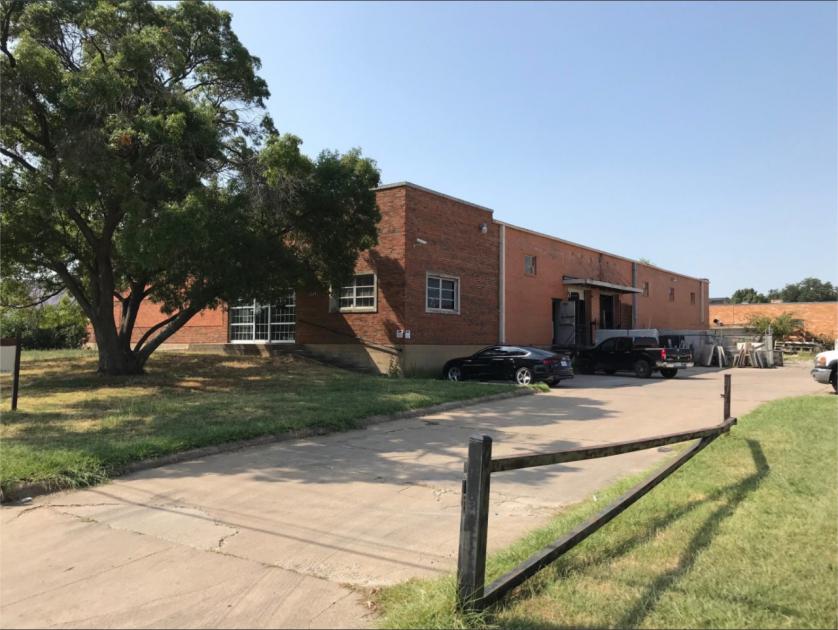
Details & Description
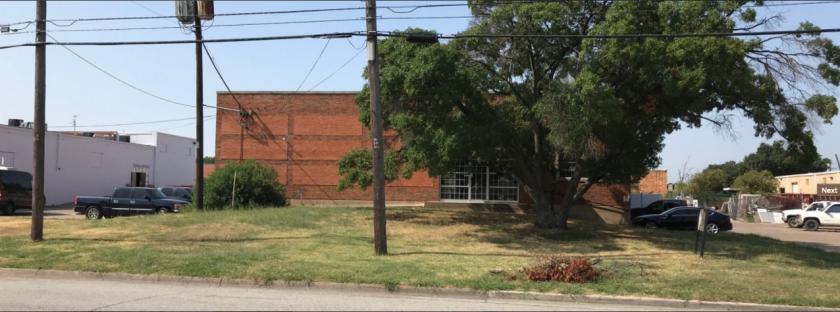
Additional Photos
Listing Agents

Chad Montgomery
O: 972-386-1463
M: 682-704-1886
cmontgomery@henrysmiller.com
O: 972-386-1463
M: 682-704-1886
cmontgomery@henrysmiller.com
While we strive to provide the most accurate information, all listing information, and demographic data, is provided by third-parties. As such, MyEListing will not be responsible for the accuracy of the information. It is strongly recommended that you verify all information with the listing agent, and any relevant agencies, prior to making any decisions.


