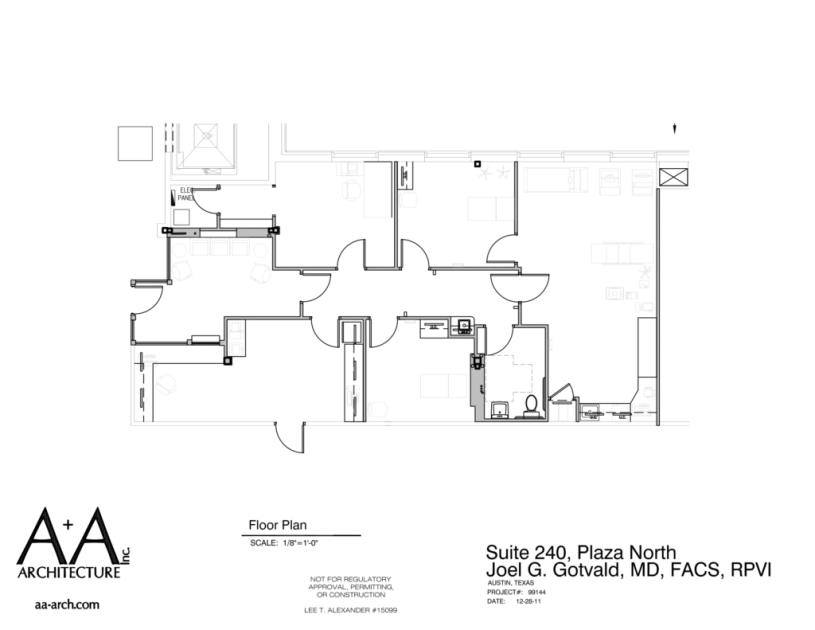
Office Space
12319 North Mopac Expressway Austin, TX 78758
12319 North Mopac Expressway Austin, TX 78758
Details & Description
Property Highlights
• Opportunity to establish a clinic in a highlypopulated residential area with strong incomes and families
• Located within Plaza North, next to St. David’s North Austin Medical Center
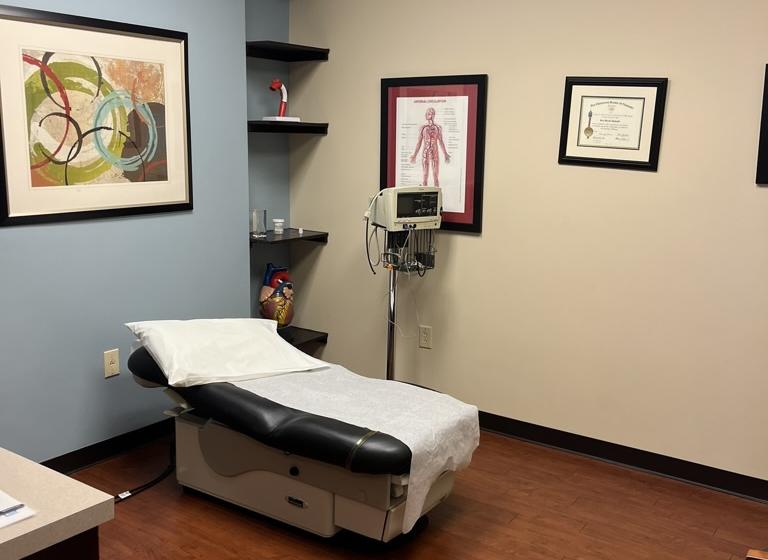
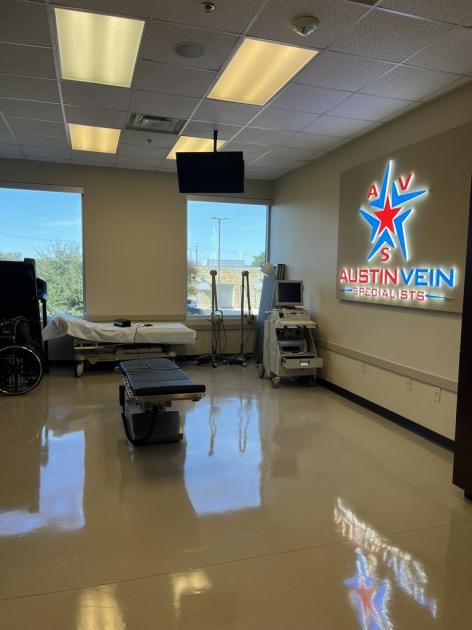
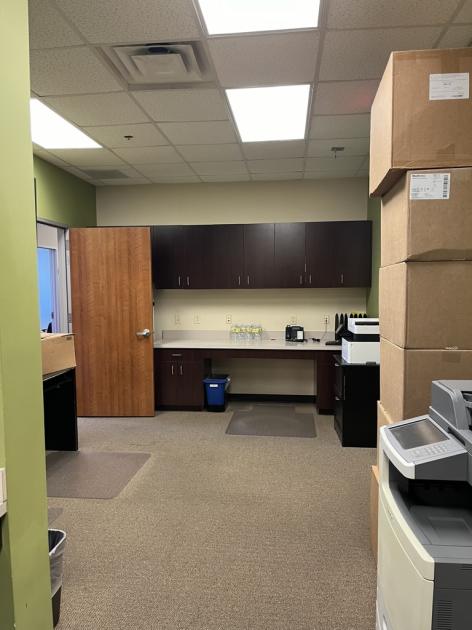
Additional Photos


Listing Agents

Macie Morris
M: 940-733-3424
macie@practicerealestategroup.com
M: 940-733-3424
macie@practicerealestategroup.com
While we strive to provide the most accurate information, all listing information, and demographic data, is provided by third-parties. As such, MyEListing will not be responsible for the accuracy of the information. It is strongly recommended that you verify all information with the listing agent, and any relevant agencies, prior to making any decisions.