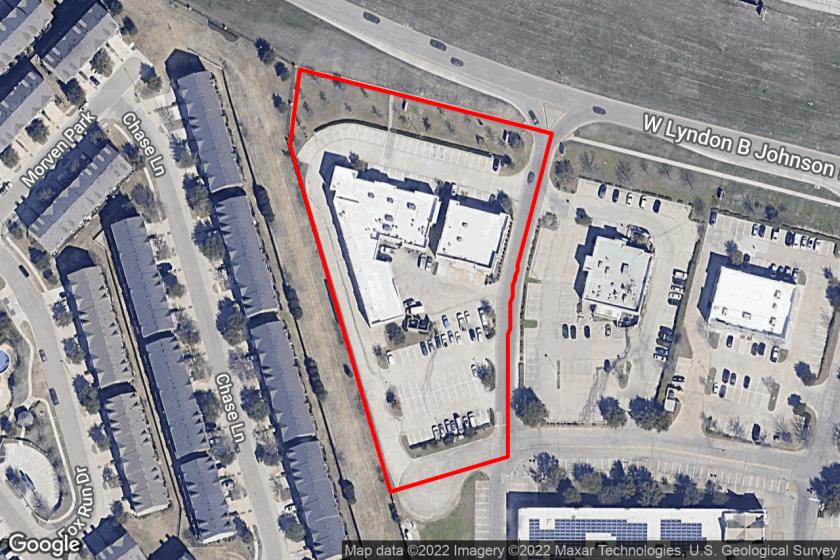
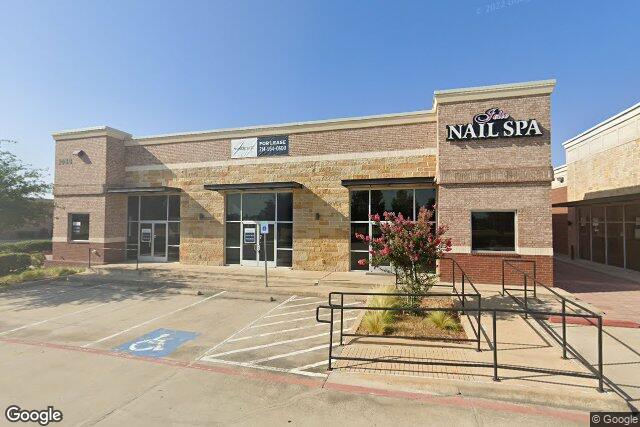
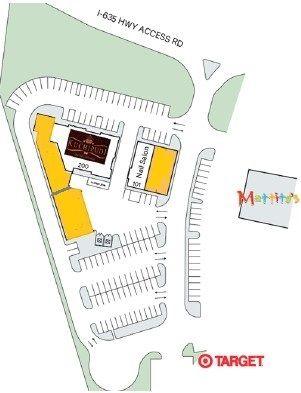
1-Mile | 3-Miles | 5-Miles | ||
---|---|---|---|---|
Total Population | 12,749 | 69,325 | 196,539 | |
Population Median Age | 33 | 32 | 34 | |
Population by Age | 0-9 Yrs | 2001 (15%) | 11892 (17%) | 29475 (14%) |
10-19 Yrs | 1182 (9%) | 6445 (9%) | 24251 (12%) | |
20-29 Yrs | 2388 (18%) | 11333 (16%) | 30131 (15%) | |
30-39 Yrs | 2933 (23%) | 16726 (24%) | 38123 (19%) | |
40-49 Yrs | 1682 (13%) | 10266 (14%) | 28303 (14%) | |
50-59 Yrs | 1362 (10%) | 6741 (9%) | 23494 (11%) | |
60-69 Yrs | 730 (5%) | 3980 (5%) | 13669 (6%) | |
70+ Yrs | 470 (3%) | 1942 (2%) | 9094 (4%) | |
Median HH Income | $90,826 | $94,160 | $80,694 | |
Total Household Income | < 24K | 384 (7%) | 2211 (7%) | 6905 (9%) |
25-49K | 736 (13%) | 3401 (11%) | 13019 (17%) | |
50-74K | 962 (17%) | 4438 (15%) | 15388 (20%) | |
75-99K | 969 (17%) | 5773 (19%) | 11846 (15%) | |
100-199K | 1645 (30%) | 9283 (32%) | 20190 (26%) | |
200K+ | 695 (12%) | 3843 (13%) | 8673 (11%) | |
Highest Education Level | No Diploma | 209 | 1150 | 15265 |
Diploma or GED | 734 | 4254 | 19307 | |
Some College | 947 | 5216 | 19981 | |
Assoc. Degree | 599 | 2597 | 7400 | |
Bachelors Degree | 3531 | 18837 | 41811 | |
Higher Degree | 2968 | 15753 | 28379 | |
Total Housing Units | 6,000 | 31,524 | 82,183 | |
--Owner-Occupied | 1,596 | 8,475 | 29,105 | |
--Renter-Occupied | 3,796 | 20,473 | 46,915 | |
Owner-Occupied Values | < 100K | 22 | 172 | 1290 |
100-199K | 11 | 314 | 5952 | |
200-299K | 162 | 1317 | 5897 | |
300-399K | 503 | 2330 | 5928 | |
400-499K | 603 | 2248 | 5364 | |
500K+ | 295 | 2094 | 4673 | |
Total Working Age Population | 9,935 | 53,091 | 151,775 | |
In Work Force | 7,669 | 40,301 | 114,848 | |
Not In Work Force | 2,267 | 12,790 | 36,926 | |
Workforce Employed | 7,353 | 38,789 | 110,732 | |
Workforce Unemployed | 168 | 1,319 | 3,897 | |
Civlian Workforce | 7,521 | 40,108 | 114,629 | |
Military Workforce | 147 | 193 | 219 | |
Total Households | 5,392 | 28,948 | 76,020 | |
Family Households | 3,287 | 17,835 | 49,396 | |
Non-Family Households | 2,105 | 11,114 | 26,624 | |
Married Couple | 2,820 | 14,988 | 37,978 | |
Other Family | 467 | 2,846 | 11,418 | |
Married w/Child | 1,293 | 8,406 | 19,435 | |
Single Male w/Child | 15 | 369 | 1,605 | |
Single Female w/Child | 252 | 1,367 | 4,617 |
Population Change Last Two Decades - Plus Projection
2000 | % | 2010 | % | 2020 | % | 2030 | |
---|---|---|---|---|---|---|---|
Texas | 20,851,820 | +21 | 25,145,561 | +18 | 29,677,668 | +18 | 34,894,452 |
Tarrant County | 1,446,219 | +25 | 1,809,034 | +19 | 2,143,755 | +17 | 2,507,170 |
Dallas County | 2,218,899 | +7 | 2,368,139 | +15 | 2,734,111 | +14 | 3,106,298 |
Total Working Age Population:
Total Households:
Total Working Age Population:
Total Households:
Total Working Age Population:
Total Households: