Retail Space
3111 Olympus Boulevard Coppell, TX 75019
3111 Olympus Boulevard Coppell, TX 75019
Details & Description
Property Highlights
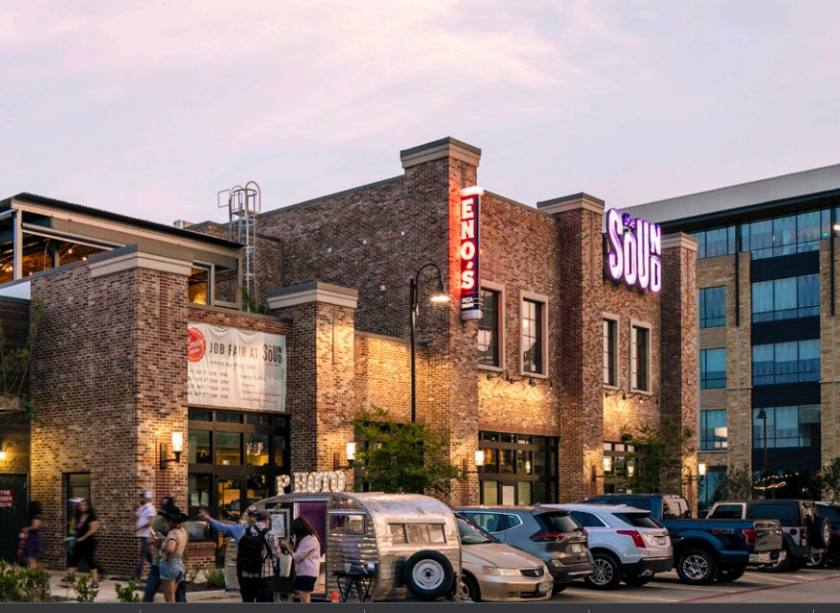
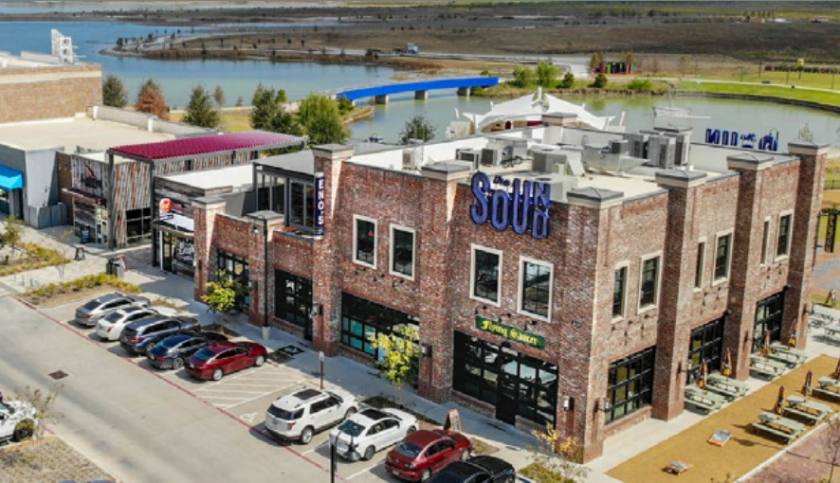
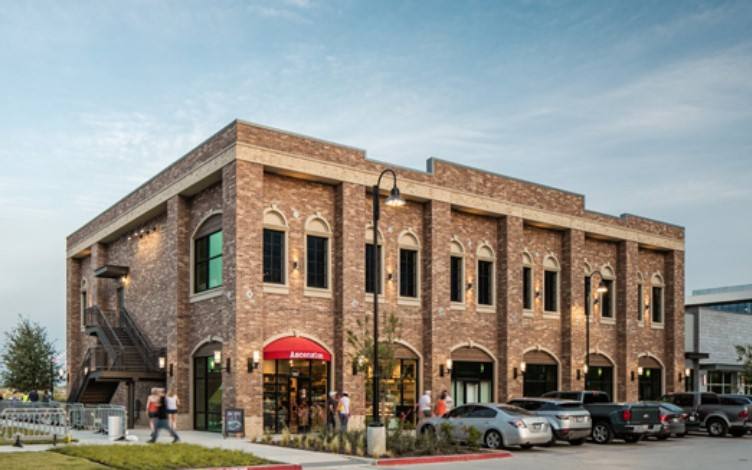
- • Lakefront retail space with patio available
- • 3.3M SF office space with 9M SF at total buildout
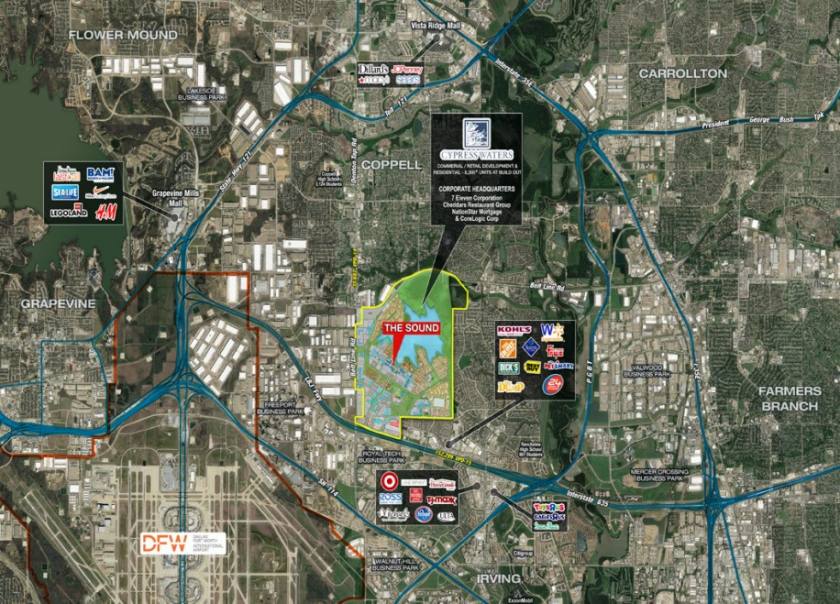
- • Located between Dallas & Ft. Worth
- • 6-mile hike and bike trail around North Lake
- • 2,337 units of high-end multi-family units
- • Non-motorized water activities
Additional Photos


Listing Agents

Thomas Glendenning
O: 214-960-4528
M: 214-960-4545
thomas@shopcompanies.com
O: 214-960-4528
M: 214-960-4545
thomas@shopcompanies.com

Jake Sherrington
O: 214-960-4545
M: 214-960-4623
jake@shopcompanies.com
O: 214-960-4545
M: 214-960-4623
jake@shopcompanies.com
While we strive to provide the most accurate information, all listing information, and demographic data, is provided by third-parties. As such, MyEListing will not be responsible for the accuracy of the information. It is strongly recommended that you verify all information with the listing agent, and any relevant agencies, prior to making any decisions.