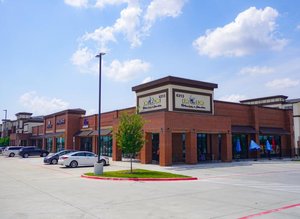
1-Mile | 3-Miles | 5-Miles | ||
---|---|---|---|---|
Total Population | 23,477 | 146,097 | 349,269 | |
Population Median Age | 36 | 39 | 38 | |
Population by Age | 0-9 Yrs | 2325 (9%) | 14906 (10%) | 36652 (10%) |
10-19 Yrs | 1920 (8%) | 14133 (9%) | 36866 (10%) | |
20-29 Yrs | 4814 (20%) | 23394 (16%) | 56604 (16%) | |
30-39 Yrs | 5586 (23%) | 26384 (18%) | 60176 (17%) | |
40-49 Yrs | 3573 (15%) | 20246 (13%) | 48937 (14%) | |
50-59 Yrs | 2116 (9%) | 18906 (12%) | 46232 (13%) | |
60-69 Yrs | 2015 (8%) | 15420 (10%) | 35192 (10%) | |
70+ Yrs | 1128 (4%) | 12708 (8%) | 28608 (8%) | |
Median HH Income | $53,621 | $71,774 | $78,311 | |
Total Household Income | < 24K | 1576 (12%) | 6964 (10%) | 15902 (10%) |
25-49K | 4152 (33%) | 14474 (22%) | 29793 (19%) | |
50-74K | 3064 (24%) | 12396 (19%) | 26750 (17%) | |
75-99K | 1255 (10%) | 8047 (12%) | 20568 (13%) | |
100-199K | 1668 (13%) | 14562 (22%) | 38022 (25%) | |
200K+ | 766 (6%) | 8144 (12%) | 19304 (12%) | |
Highest Education Level | No Diploma | 695 | 6570 | 16874 |
Diploma or GED | 3355 | 17622 | 38113 | |
Some College | 4718 | 23188 | 48730 | |
Assoc. Degree | 1322 | 7590 | 16220 | |
Bachelors Degree | 6007 | 34460 | 86087 | |
Higher Degree | 2034 | 18929 | 48078 | |
Total Housing Units | 13,930 | 70,804 | 164,377 | |
--Owner-Occupied | 2,800 | 28,111 | 67,538 | |
--Renter-Occupied | 9,681 | 36,478 | 82,802 | |
Owner-Occupied Values | < 100K | 44 | 577 | 1392 |
100-199K | 265 | 4442 | 10056 | |
200-299K | 899 | 7484 | 16073 | |
300-399K | 1166 | 5263 | 14719 | |
400-499K | 265 | 3152 | 10190 | |
500K+ | 162 | 7193 | 15107 | |
Total Working Age Population | 19,969 | 122,365 | 289,785 | |
In Work Force | 16,459 | 92,043 | 216,519 | |
Not In Work Force | 3,510 | 30,322 | 73,266 | |
Workforce Employed | 15,789 | 88,732 | 207,770 | |
Workforce Unemployed | 665 | 3,184 | 8,548 | |
Civlian Workforce | 16,454 | 91,916 | 216,318 | |
Military Workforce | 6 | 126 | 201 | |
Total Households | 12,481 | 64,589 | 150,339 | |
Family Households | 5,318 | 36,286 | 85,999 | |
Non-Family Households | 7,163 | 28,302 | 64,340 | |
Married Couple | 3,216 | 27,053 | 65,968 | |
Other Family | 2,102 | 9,233 | 20,031 | |
Married w/Child | 1,306 | 10,222 | 26,764 | |
Single Male w/Child | 209 | 1,121 | 2,143 | |
Single Female w/Child | 1,126 | 4,364 | 8,596 |
Population Change Last Two Decades - Plus Projection
2000 | % | 2010 | % | 2020 | % | 2030 | |
---|---|---|---|---|---|---|---|
Texas | 20,851,820 | +21 | 25,145,561 | +18 | 29,677,668 | +18 | 34,894,452 |
Denton County | 432,976 | +53 | 662,614 | +36 | 897,953 | +37 | 1,234,110 |
Collin County | 491,675 | +59 | 782,341 | +33 | 1,039,369 | +34 | 1,391,461 |
Dallas County | 2,218,899 | +7 | 2,368,139 | +15 | 2,734,111 | +14 | 3,106,298 |
Total Working Age Population:
Total Households:
Total Working Age Population:
Total Households:
Total Working Age Population:
Total Households: