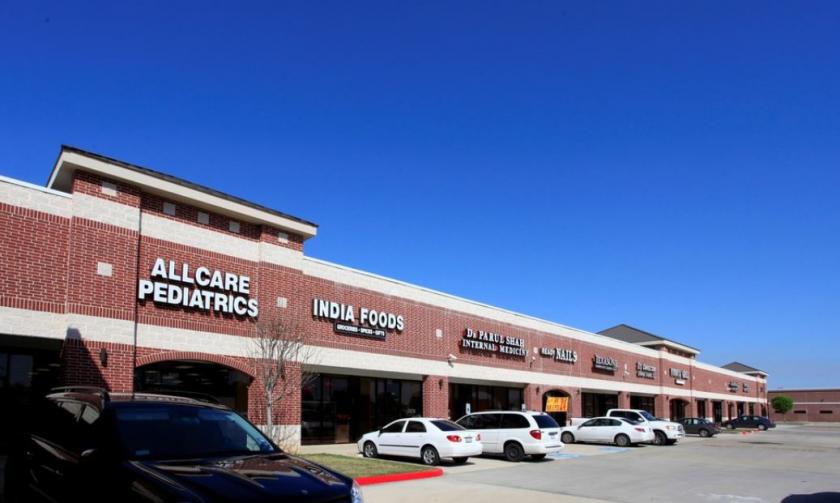
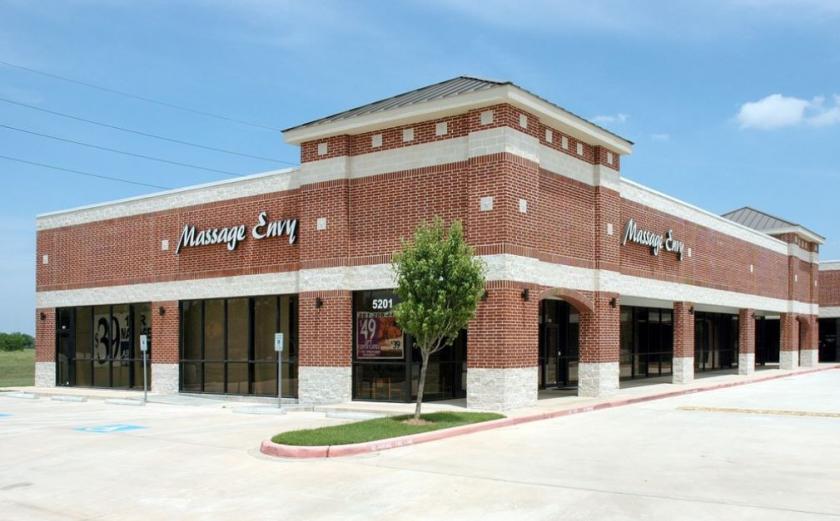
1-Mile | 3-Miles | 5-Miles | ||
---|---|---|---|---|
Total Population | 11,247 | 97,988 | 200,062 | |
Population Median Age | 39 | 39 | 39 | |
Population by Age | 0-9 Yrs | 1567 (13%) | 12142 (12%) | 24269 (12%) |
10-19 Yrs | 1382 (12%) | 12545 (12%) | 26742 (13%) | |
20-29 Yrs | 938 (8%) | 11654 (11%) | 25008 (12%) | |
30-39 Yrs | 1779 (15%) | 12797 (13%) | 26800 (13%) | |
40-49 Yrs | 1216 (10%) | 12516 (12%) | 26916 (13%) | |
50-59 Yrs | 1714 (15%) | 13569 (13%) | 27371 (13%) | |
60-69 Yrs | 1765 (15%) | 14440 (14%) | 26899 (13%) | |
70+ Yrs | 885 (7%) | 8325 (8%) | 16056 (8%) | |
Median HH Income | $114,662 | $96,651 | $95,520 | |
Total Household Income | < 24K | 231 (6%) | 3003 (8%) | 5916 (8%) |
25-49K | 319 (8%) | 4946 (14%) | 9930 (14%) | |
50-74K | 421 (11%) | 5176 (15%) | 10701 (15%) | |
75-99K | 551 (15%) | 4295 (12%) | 8882 (13%) | |
100-199K | 1414 (39%) | 10428 (30%) | 20489 (30%) | |
200K+ | 686 (18%) | 5842 (17%) | 11758 (17%) | |
Highest Education Level | No Diploma | 548 | 5101 | 10788 |
Diploma or GED | 948 | 9968 | 21325 | |
Some College | 1039 | 11047 | 23425 | |
Assoc. Degree | 464 | 5427 | 10221 | |
Bachelors Degree | 2863 | 22056 | 43073 | |
Higher Degree | 2077 | 14033 | 28178 | |
Total Housing Units | 3,862 | 35,252 | 70,937 | |
--Owner-Occupied | 3,060 | 25,181 | 49,981 | |
--Renter-Occupied | 561 | 8,509 | 17,696 | |
Owner-Occupied Values | < 100K | 68 | 1494 | 3223 |
100-199K | 437 | 6045 | 13326 | |
200-299K | 1320 | 8061 | 13174 | |
300-399K | 853 | 4780 | 8276 | |
400-499K | 224 | 1945 | 4818 | |
500K+ | 159 | 2855 | 7163 | |
Total Working Age Population | 8,908 | 78,353 | 159,371 | |
In Work Force | 5,752 | 52,458 | 107,713 | |
Not In Work Force | 3,156 | 25,895 | 51,658 | |
Workforce Employed | 5,460 | 49,400 | 101,825 | |
Workforce Unemployed | 292 | 3,033 | 5,849 | |
Civlian Workforce | 5,752 | 52,433 | 107,673 | |
Military Workforce | 0 | 25 | 40 | |
Total Households | 3,622 | 33,690 | 67,677 | |
Family Households | 3,091 | 26,349 | 52,758 | |
Non-Family Households | 531 | 7,342 | 14,919 | |
Married Couple | 2,569 | 21,048 | 41,520 | |
Other Family | 523 | 5,301 | 11,237 | |
Married w/Child | 1,117 | 9,137 | 18,217 | |
Single Male w/Child | 38 | 345 | 872 | |
Single Female w/Child | 212 | 1,908 | 3,976 |
Population Change Last Two Decades - Plus Projection
2000 | % | 2010 | % | 2020 | % | 2030 | |
---|---|---|---|---|---|---|---|
Texas | 20,851,820 | +21 | 25,145,561 | +18 | 29,677,668 | +18 | 34,894,452 |
Brazoria County | 241,767 | +30 | 313,166 | +20 | 375,869 | +20 | 452,517 |
Fort Bend County | 354,452 | +65 | 585,375 | +44 | 840,383 | +43 | 1,203,029 |
Harris County | 3,400,578 | +20 | 4,092,459 | +22 | 4,978,845 | +19 | 5,924,750 |
Total Working Age Population:
Total Households:
Total Working Age Population:
Total Households:
Total Working Age Population:
Total Households: