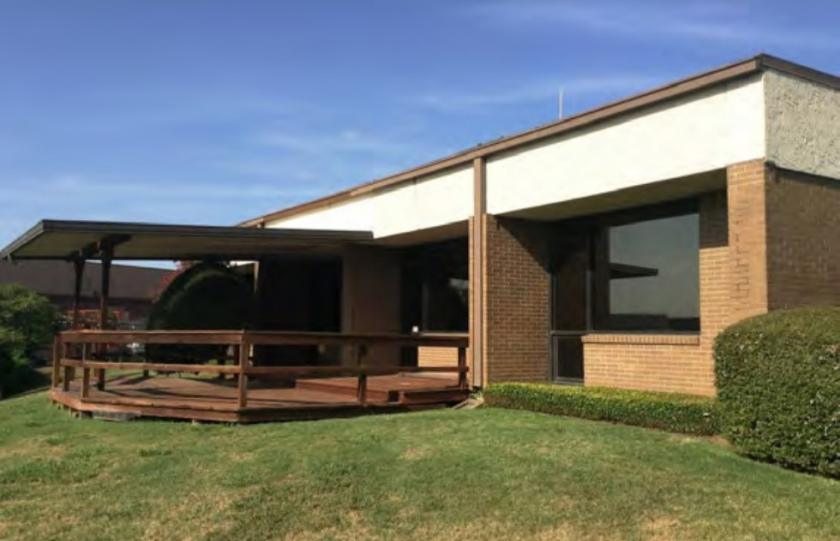
Flex-Office-Warehouse
2244 Century Circle Irving, TX 75062
2244 Century Circle Irving, TX 75062

Details & Description
Property Highlights
- • 30 Parking Spaces
- • 16’ Clear Height
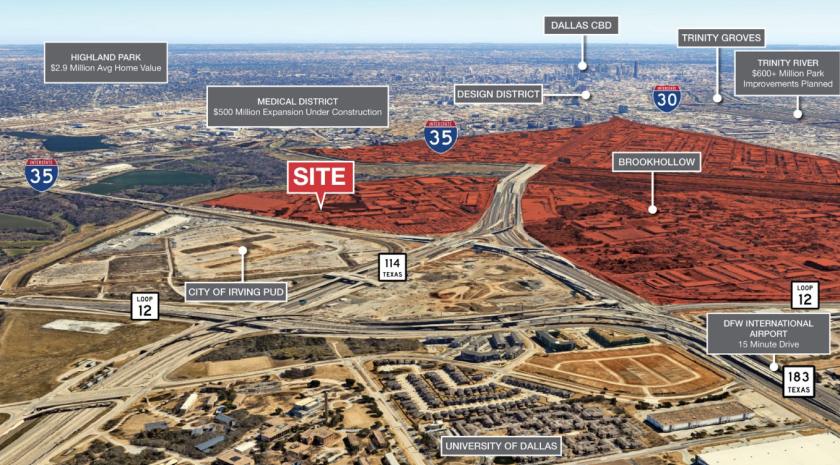
- • 7.5 Miles to Dallas Love Field
- • 14 Miles to DFW International Airport
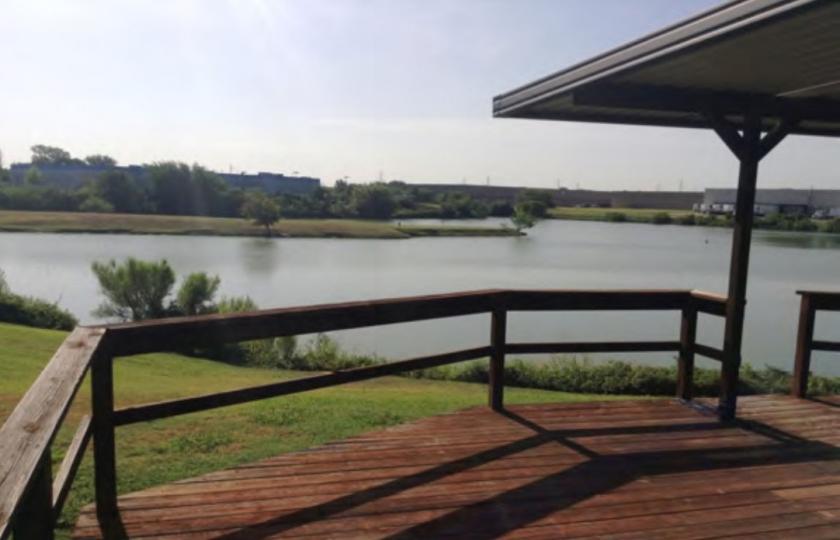
Additional Photos
Listing Agents

Chase Miller
O: 214-256-7131
M: 214-770-5495
cmiller@nairl.com
O: 214-256-7131
M: 214-770-5495
cmiller@nairl.com
While we strive to provide the most accurate information, all listing information, and demographic data, is provided by third-parties. As such, MyEListing will not be responsible for the accuracy of the information. It is strongly recommended that you verify all information with the listing agent, and any relevant agencies, prior to making any decisions.


