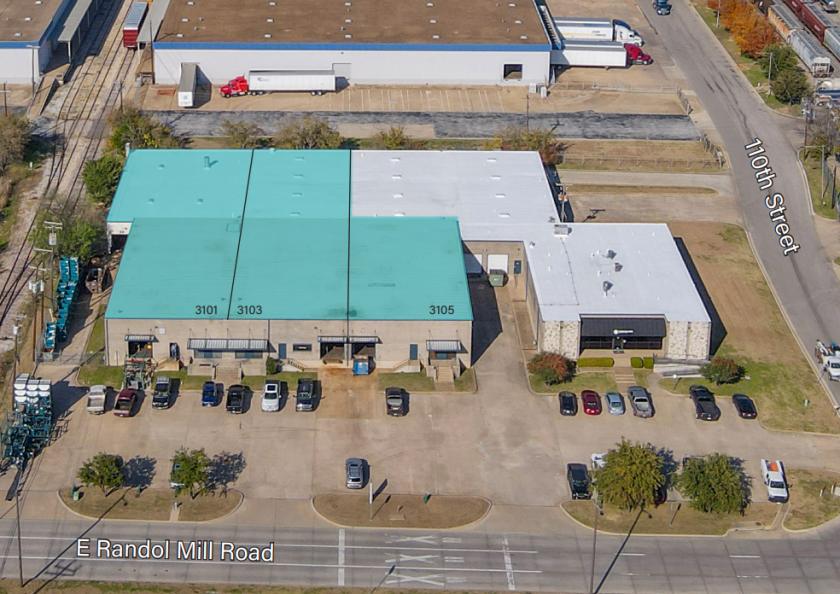
1-Mile | 3-Miles | 5-Miles | ||
---|---|---|---|---|
Total Population | 2,627 | 99,921 | 283,588 | |
Population Median Age | 35 | 33 | 33 | |
Population by Age | 0-9 Yrs | 256 (9%) | 16194 (16%) | 44860 (15%) |
10-19 Yrs | 310 (11%) | 13652 (13%) | 42250 (14%) | |
20-29 Yrs | 793 (30%) | 19040 (19%) | 52629 (18%) | |
30-39 Yrs | 282 (10%) | 14519 (14%) | 40487 (14%) | |
40-49 Yrs | 322 (12%) | 12620 (12%) | 36678 (12%) | |
50-59 Yrs | 272 (10%) | 10754 (10%) | 29211 (10%) | |
60-69 Yrs | 283 (10%) | 7468 (7%) | 21498 (7%) | |
70+ Yrs | 110 (4%) | 5672 (5%) | 15974 (5%) | |
Median HH Income | $33,697 | $48,242 | $50,397 | |
Total Household Income | < 24K | 362 (39%) | 7546 (20%) | 20577 (20%) |
25-49K | 170 (18%) | 11586 (31%) | 28869 (28%) | |
50-74K | 105 (11%) | 7664 (20%) | 20330 (20%) | |
75-99K | 204 (22%) | 4589 (12%) | 12588 (12%) | |
100-199K | 54 (5%) | 4654 (12%) | 14596 (14%) | |
200K+ | 20 (2%) | 875 (2%) | 2650 (2%) | |
Highest Education Level | No Diploma | 510 | 14934 | 40238 |
Diploma or GED | 378 | 17908 | 47606 | |
Some College | 465 | 13145 | 35854 | |
Assoc. Degree | 59 | 4034 | 11608 | |
Bachelors Degree | 60 | 8108 | 24740 | |
Higher Degree | 8 | 3629 | 12064 | |
Total Housing Units | 937 | 41,362 | 109,546 | |
--Owner-Occupied | 224 | 12,790 | 40,015 | |
--Renter-Occupied | 691 | 24,125 | 59,596 | |
Owner-Occupied Values | < 100K | 51 | 3961 | 10047 |
100-199K | 131 | 5222 | 19039 | |
200-299K | 41 | 2384 | 7284 | |
300-399K | 2 | 476 | 2128 | |
400-499K | 0 | 491 | 894 | |
500K+ | 0 | 256 | 623 | |
Total Working Age Population | 2,224 | 75,514 | 213,640 | |
In Work Force | 1,655 | 53,139 | 148,673 | |
Not In Work Force | 569 | 22,375 | 64,967 | |
Workforce Employed | 1,603 | 50,314 | 140,206 | |
Workforce Unemployed | 53 | 2,804 | 8,399 | |
Civlian Workforce | 1,655 | 53,118 | 148,605 | |
Military Workforce | 0 | 21 | 68 | |
Total Households | 916 | 36,914 | 99,611 | |
Family Households | 545 | 22,210 | 63,024 | |
Non-Family Households | 371 | 14,704 | 36,587 | |
Married Couple | 140 | 14,091 | 40,759 | |
Other Family | 406 | 8,119 | 22,265 | |
Married w/Child | 52 | 6,197 | 18,690 | |
Single Male w/Child | 14 | 1,018 | 3,046 | |
Single Female w/Child | 90 | 3,572 | 9,983 |
Population Change Last Two Decades - Plus Projection
2000 | % | 2010 | % | 2020 | % | 2030 | |
---|---|---|---|---|---|---|---|
Texas | 20,851,820 | +21 | 25,145,561 | +18 | 29,677,668 | +18 | 34,894,452 |
Tarrant County | 1,446,219 | +25 | 1,809,034 | +19 | 2,143,755 | +17 | 2,507,170 |
Dallas County | 2,218,899 | +7 | 2,368,139 | +15 | 2,734,111 | +14 | 3,106,298 |
Total Working Age Population:
Total Households:
Total Working Age Population:
Total Households:
Total Working Age Population:
Total Households: