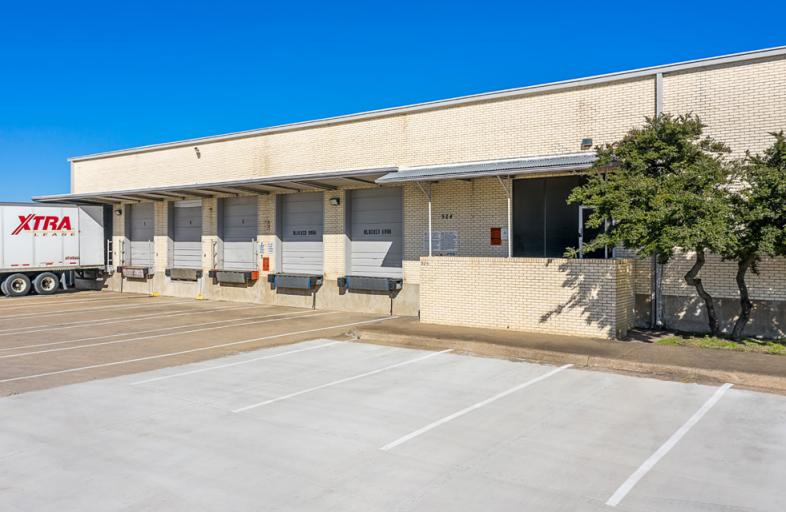
Flex-Office-Warehouse
924 111th Street Arlington, TX 76011
924 111th Street Arlington, TX 76011
Details & Description
Property Highlights
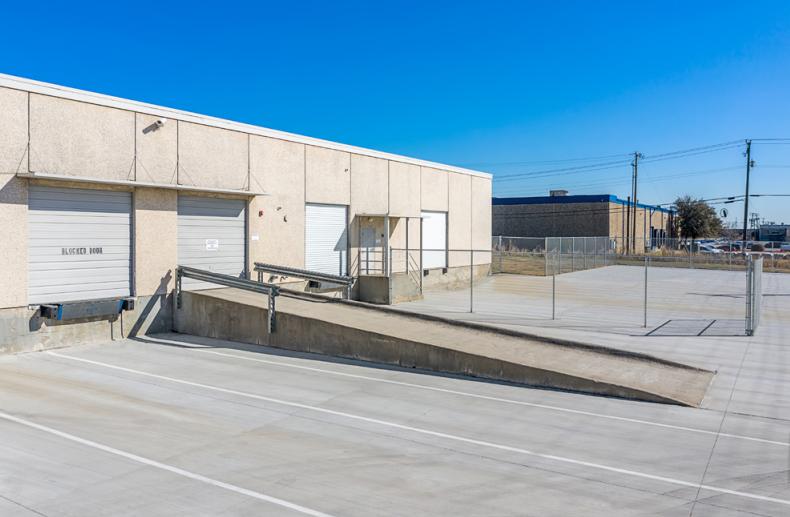
- • 1,584 SF Office
- • 16’ Clear Height
- • Two (2) Grade Level Doors
- • Two (2) Rail Doors
- • Sprinklered
- • Power: 600A/480V/3Ø
Additional Photos

Listing Agents

Jeffry Jackson
O: 817-872-3910
M: 817-559-1991
jjackson@nairl.com
O: 817-872-3910
M: 817-559-1991
jjackson@nairl.com
While we strive to provide the most accurate information, all listing information, and demographic data, is provided by third-parties. As such, MyEListing will not be responsible for the accuracy of the information. It is strongly recommended that you verify all information with the listing agent, and any relevant agencies, prior to making any decisions.