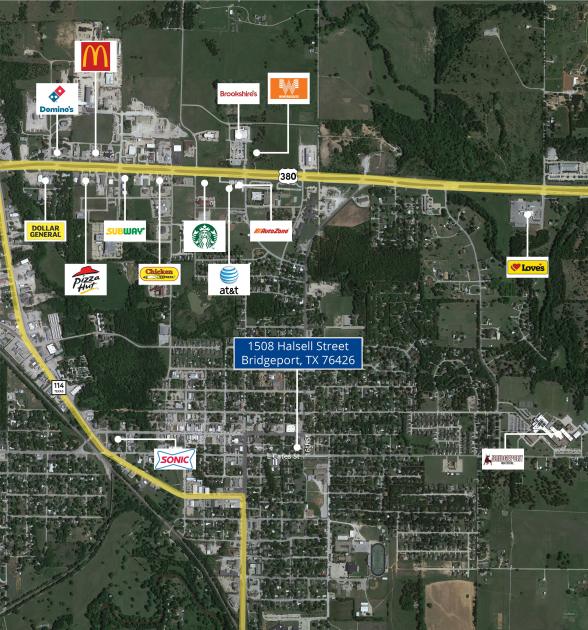
1-Mile | 3-Miles | 5-Miles | ||
---|---|---|---|---|
Total Population | 3,254 | 6,726 | 10,370 | |
Population Median Age | 33 | 37 | 39 | |
Population by Age | 0-9 Yrs | 560 (17%) | 819 (12%) | 1067 (10%) |
10-19 Yrs | 595 (18%) | 1208 (17%) | 1741 (16%) | |
20-29 Yrs | 482 (14%) | 883 (13%) | 1218 (11%) | |
30-39 Yrs | 270 (8%) | 650 (9%) | 1123 (10%) | |
40-49 Yrs | 474 (14%) | 1066 (15%) | 1703 (16%) | |
50-59 Yrs | 445 (13%) | 1006 (14%) | 1476 (14%) | |
60-69 Yrs | 211 (6%) | 458 (6%) | 808 (7%) | |
70+ Yrs | 216 (6%) | 636 (9%) | 1232 (11%) | |
Median HH Income | $57,995 | $58,004 | $60,486 | |
Total Household Income | < 24K | 92 (9%) | 322 (15%) | 541 (16%) |
25-49K | 280 (29%) | 507 (25%) | 724 (22%) | |
50-74K | 249 (26%) | 426 (21%) | 606 (18%) | |
75-99K | 124 (13%) | 271 (13%) | 496 (15%) | |
100-199K | 179 (18%) | 445 (21%) | 718 (22%) | |
200K+ | 26 (2%) | 57 (2%) | 134 (4%) | |
Highest Education Level | No Diploma | 455 | 1029 | 1483 |
Diploma or GED | 462 | 1255 | 2323 | |
Some College | 483 | 876 | 1289 | |
Assoc. Degree | 126 | 292 | 510 | |
Bachelors Degree | 227 | 595 | 984 | |
Higher Degree | 130 | 237 | 379 | |
Total Housing Units | 1,088 | 2,271 | 3,564 | |
--Owner-Occupied | 565 | 1,327 | 2,280 | |
--Renter-Occupied | 383 | 701 | 939 | |
Owner-Occupied Values | < 100K | 140 | 379 | 593 |
100-199K | 282 | 572 | 877 | |
200-299K | 135 | 295 | 512 | |
300-399K | 7 | 45 | 118 | |
400-499K | 0 | 20 | 79 | |
500K+ | 0 | 16 | 101 | |
Total Working Age Population | 2,380 | 5,288 | 8,387 | |
In Work Force | 1,755 | 3,430 | 5,207 | |
Not In Work Force | 625 | 1,858 | 3,180 | |
Workforce Employed | 1,638 | 3,226 | 4,928 | |
Workforce Unemployed | 117 | 204 | 279 | |
Civlian Workforce | 1,755 | 3,430 | 5,207 | |
Military Workforce | 0 | 0 | 0 | |
Total Households | 949 | 2,028 | 3,220 | |
Family Households | 672 | 1,451 | 2,351 | |
Non-Family Households | 277 | 577 | 869 | |
Married Couple | 584 | 1,103 | 1,773 | |
Other Family | 88 | 348 | 578 | |
Married w/Child | 322 | 536 | 787 | |
Single Male w/Child | 22 | 88 | 138 | |
Single Female w/Child | 20 | 114 | 161 |
Population Change Last Two Decades - Plus Projection
2000 | % | 2010 | % | 2020 | % | 2030 | |
---|---|---|---|---|---|---|---|
Texas | 20,851,820 | +21 | 25,145,561 | +18 | 29,677,668 | +18 | 34,894,452 |
Wise County | 48,793 | +21 | 59,127 | +11 | 65,807 | +9 | 71,909 |
Total Working Age Population:
Total Households:
Total Working Age Population:
Total Households:
Total Working Age Population:
Total Households: