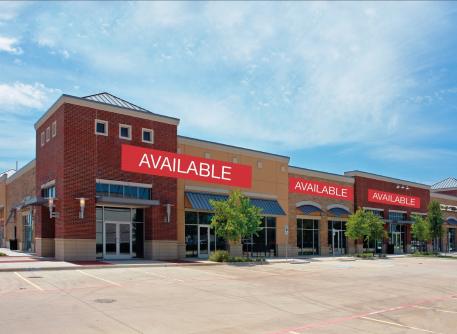
Retail Space
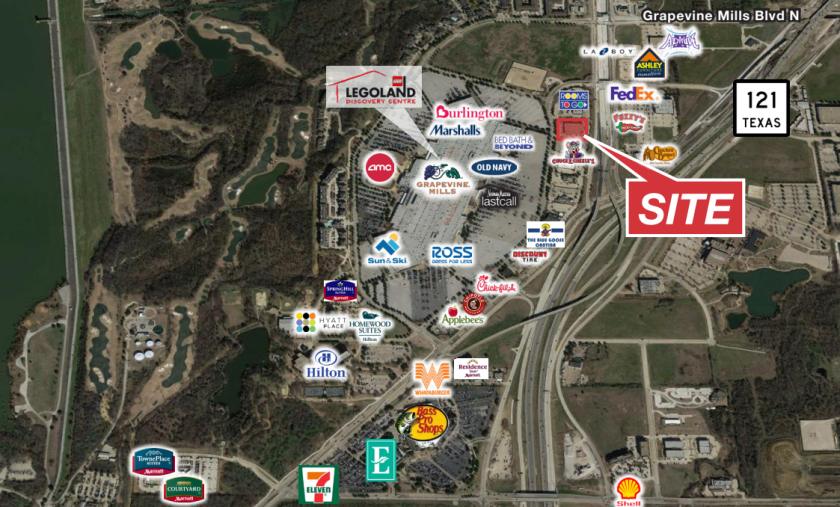
2805 East Grapevine Mills Circle Grapevine, TX 76051
2805 East Grapevine Mills Circle Grapevine, TX 76051
Details & Description
Property Highlights
• Minutes from Downtown Grapevine & DFW International Airport
• Located at Main North Entrance of Grapevine Mills Mall
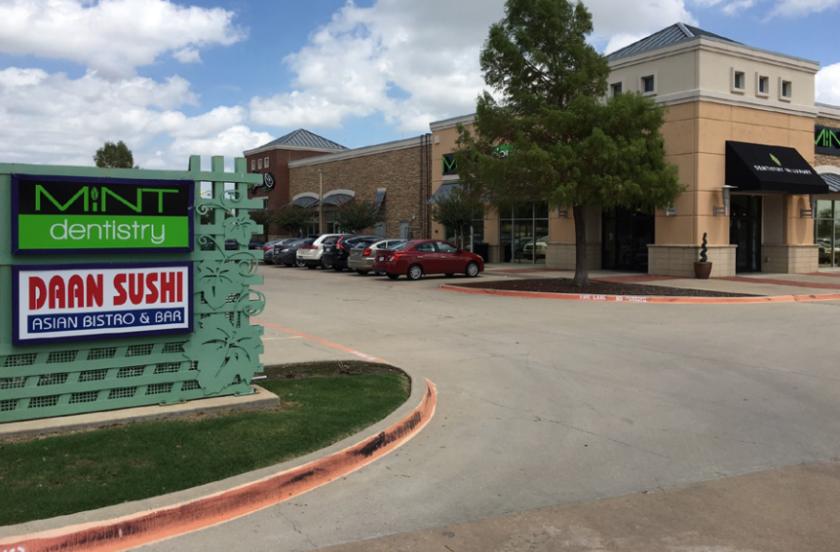
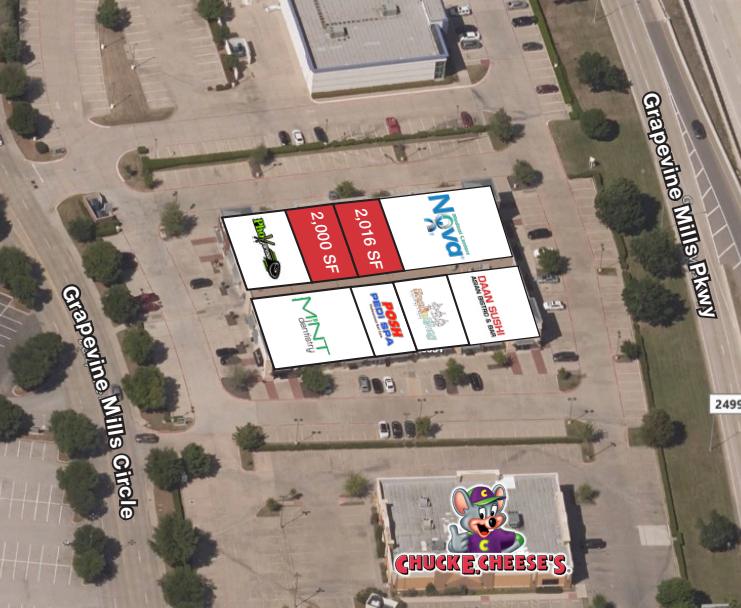
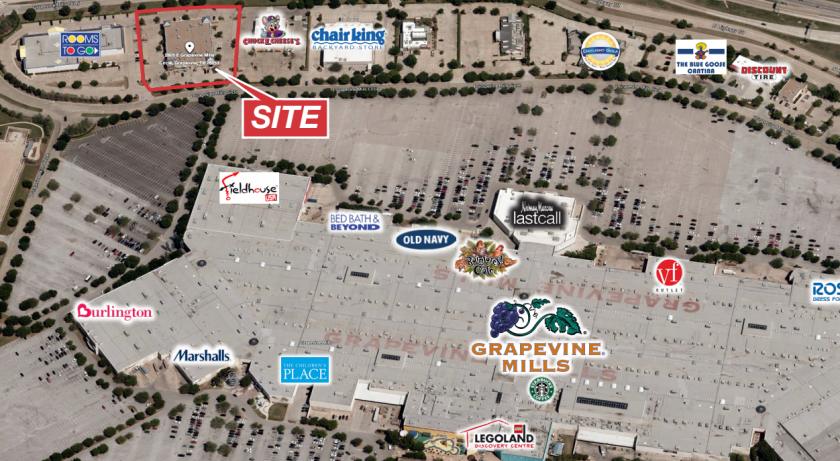
Additional Photos
Listing Agents

Hunter Hayes
O: 817-872-3911
M: 817-487-7200
hhayes@nairl.com
O: 817-872-3911
M: 817-487-7200
hhayes@nairl.com
While we strive to provide the most accurate information, all listing information, and demographic data, is provided by third-parties. As such, MyEListing will not be responsible for the accuracy of the information. It is strongly recommended that you verify all information with the listing agent, and any relevant agencies, prior to making any decisions.


