Retail Space
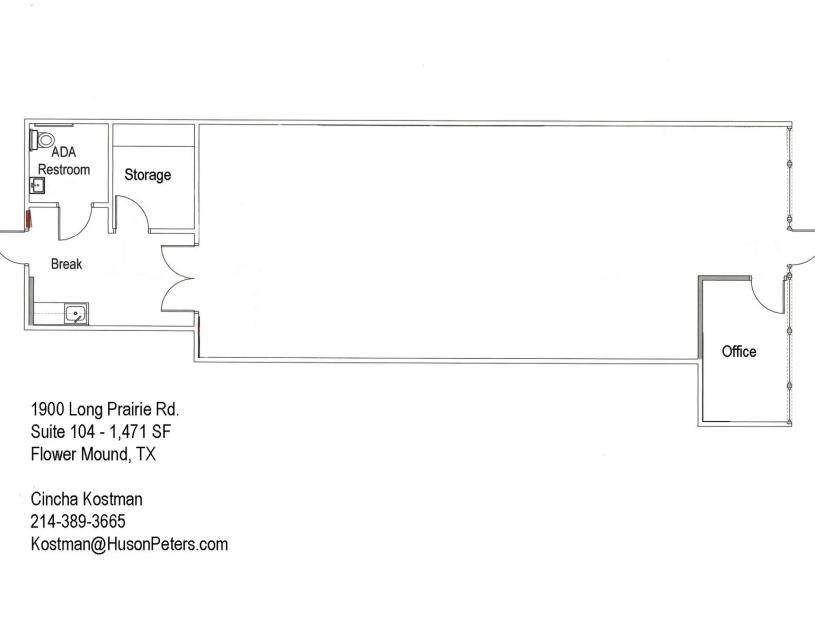
1900 Long Prairie Road Flower Mound, TX 75022
1900 Long Prairie Road Flower Mound, TX 75022
Details & Description
Property Highlights
- • $19.50-20.50/SF NNN
- • Ste 104: 1,471 ± SF
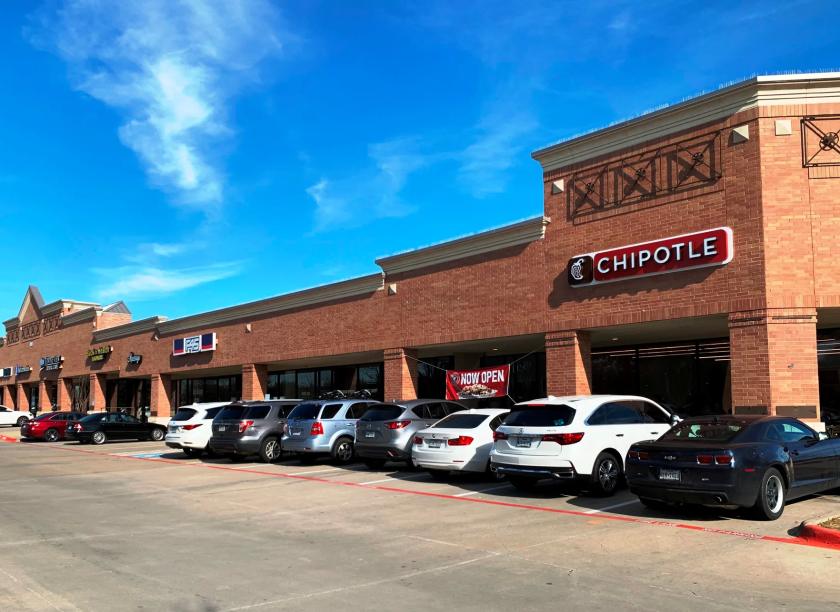
- • Next to Chipotle and facing south
- • Monument Signage Available
- • Anchored by restaurants plus great demographics
- • Traffic Count: 40,000 vpd
Listing Agents

Cincha Kostman
O: 214-389-3665
M: 214-212-1998
Kostman@HudsonPeters.com
O: 214-389-3665
M: 214-212-1998
Kostman@HudsonPeters.com
While we strive to provide the most accurate information, all listing information, and demographic data, is provided by third-parties. As such, MyEListing will not be responsible for the accuracy of the information. It is strongly recommended that you verify all information with the listing agent, and any relevant agencies, prior to making any decisions.