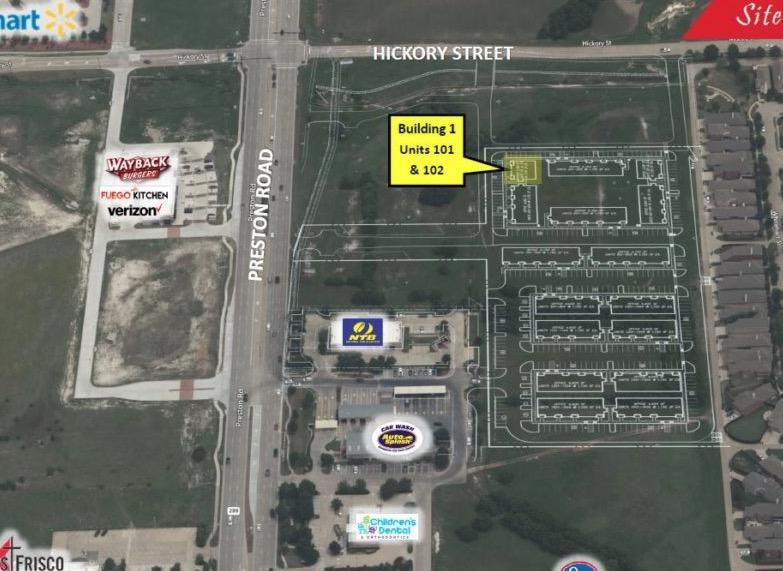
Office Space
Hickory St Frisco, TX 75034
Hickory St Frisco, TX 75034

Details & Description
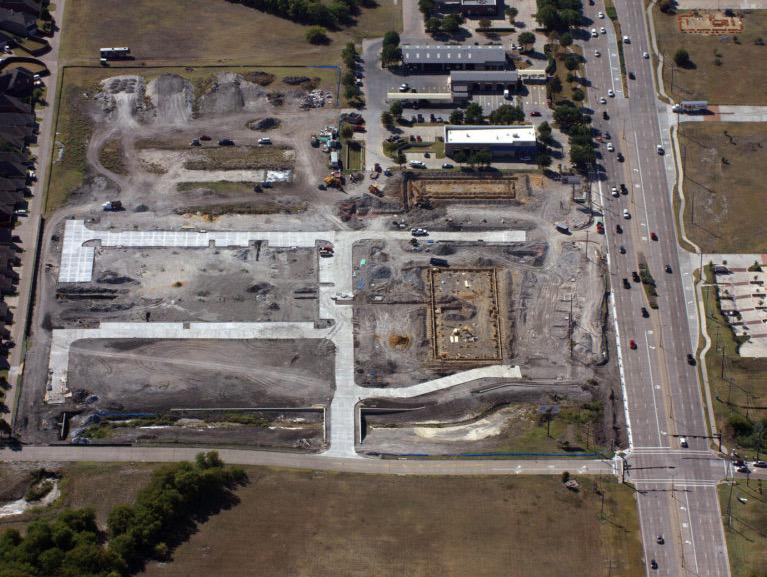
Additional Photos

Listing Agents

Justin Keane
M: 214-686-9007
justink@wynmarkcommercial.com
M: 214-686-9007
justink@wynmarkcommercial.com
While we strive to provide the most accurate information, all listing information, and demographic data, is provided by third-parties. As such, MyEListing will not be responsible for the accuracy of the information. It is strongly recommended that you verify all information with the listing agent, and any relevant agencies, prior to making any decisions.


