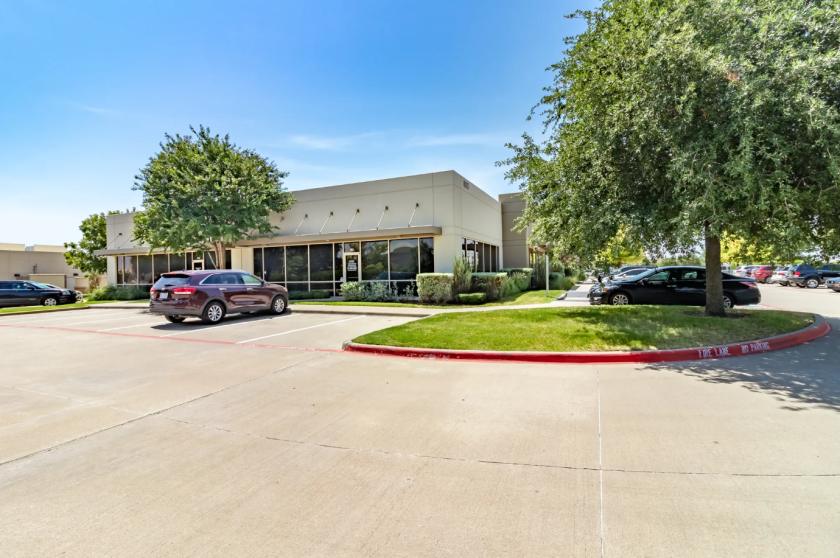
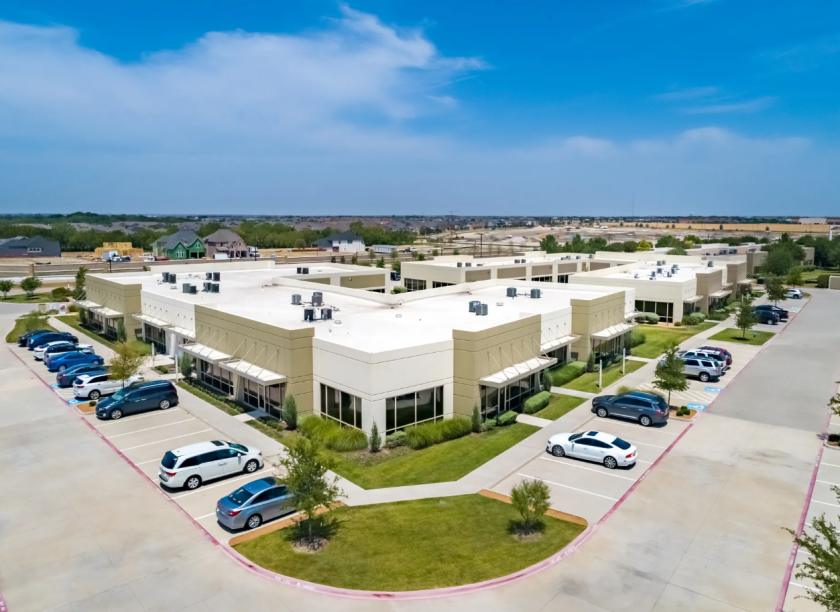
Office Space
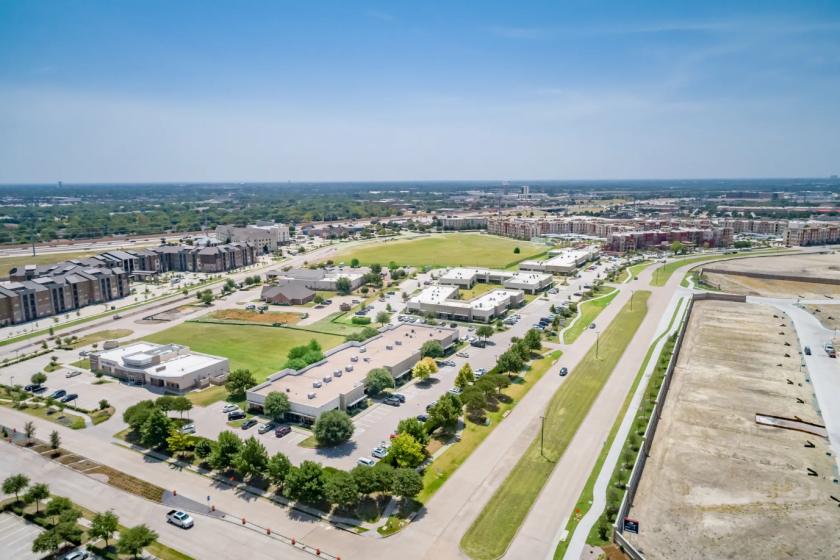
800 North Watters Road Allen, TX 75013
800 North Watters Road Allen, TX 75013
Details & Description
Property Highlights
- • 4.9/1,000 Parking Ratio
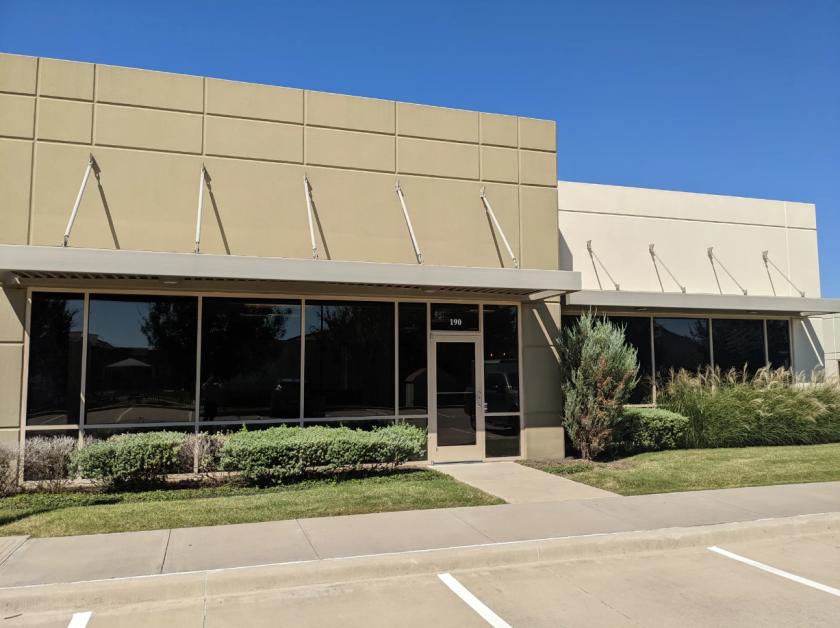
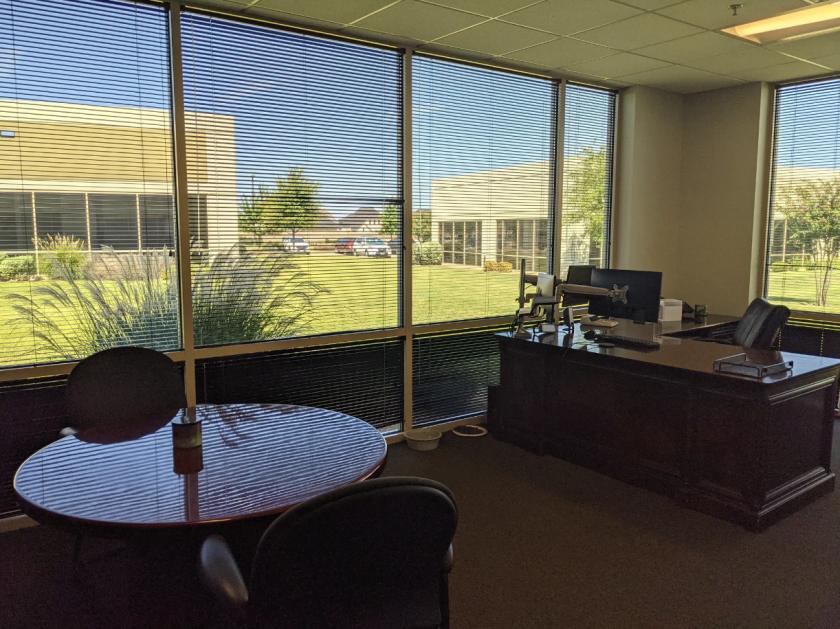
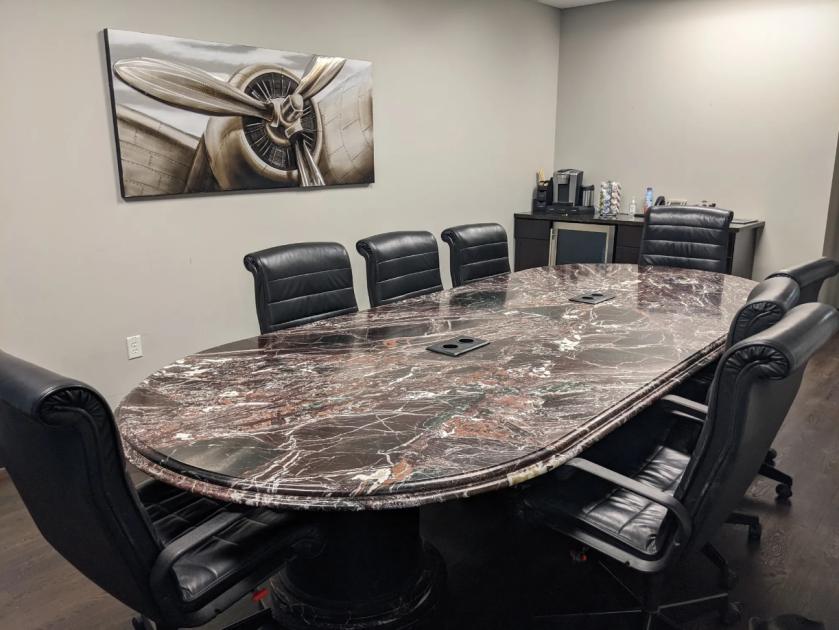
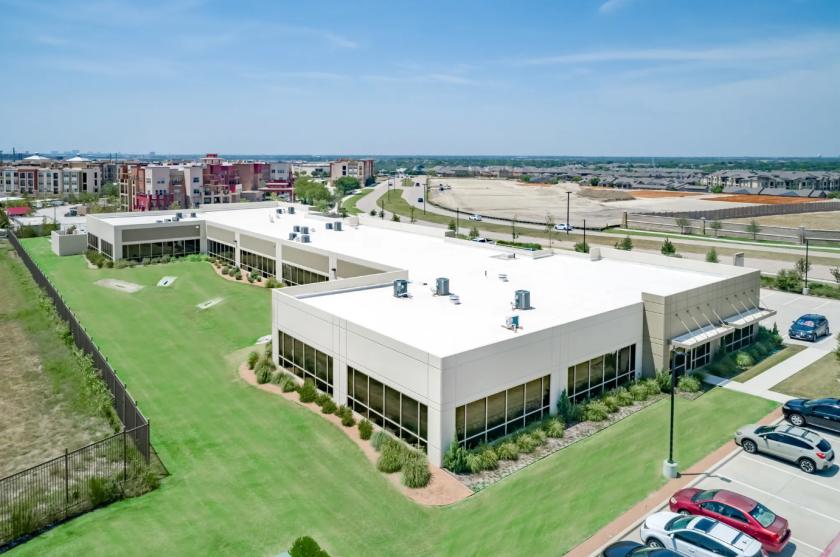
- • Floor to ceiling glass
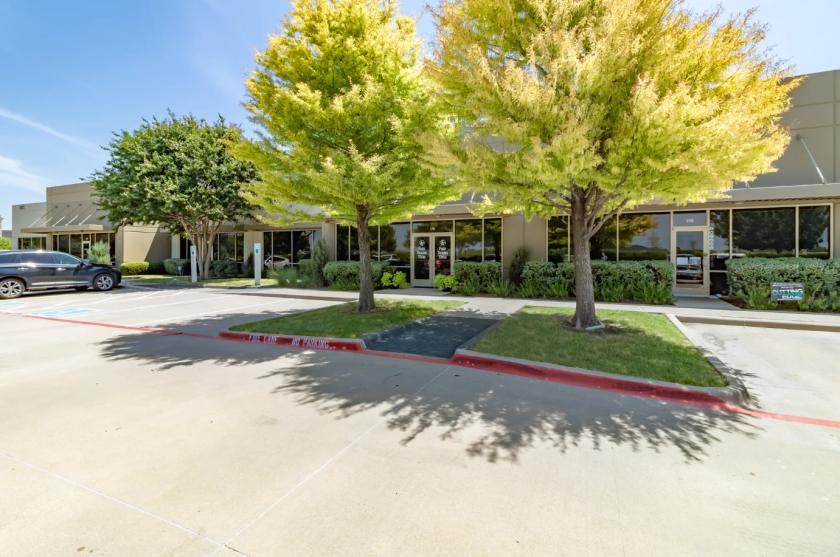
- • Private entry and restrooms
- • OPEX for 740 N Watters estimated at $9.06/SF/Year
- • OPEX for 760 N Watters estimated at $8.89/SF/Year
- • OPEX for 800 N Watters estimated at $9.33/SF/Year
Additional Photos

Listing Agents

Michelle Hudson
O: 214-389-3663
M: 214-534-0226
Hudson@HudsonPeters.com
O: 214-389-3663
M: 214-534-0226
Hudson@HudsonPeters.com

Tom Hudson
Hudson Peters Commercial
O: 214-389-3667
M: 214-389-3667
tom@hudsonpeters.com
Hudson Peters Commercial
O: 214-389-3667
M: 214-389-3667
tom@hudsonpeters.com
While we strive to provide the most accurate information, all listing information, and demographic data, is provided by third-parties. As such, MyEListing will not be responsible for the accuracy of the information. It is strongly recommended that you verify all information with the listing agent, and any relevant agencies, prior to making any decisions.