Office Space
1010 West Mockingbird Lane Dallas, TX 75247
1010 West Mockingbird Lane Dallas, TX 75247
Details & Description
Property Highlights
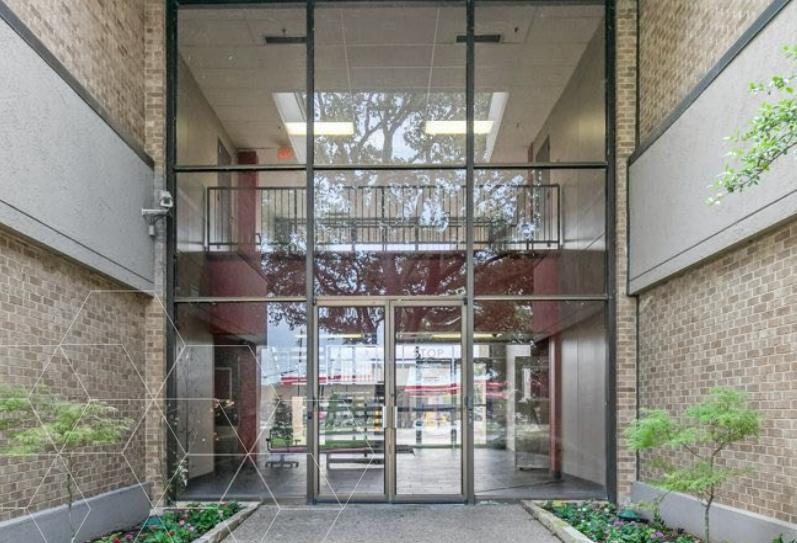
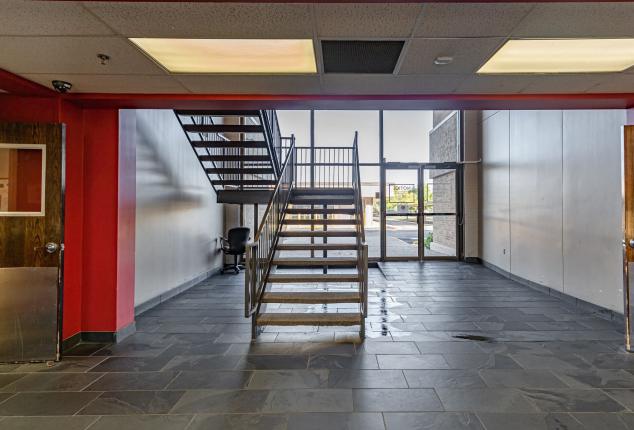
- • Updated lobby area featuring new tile ooring
- • Repainted exterior/interior common areas
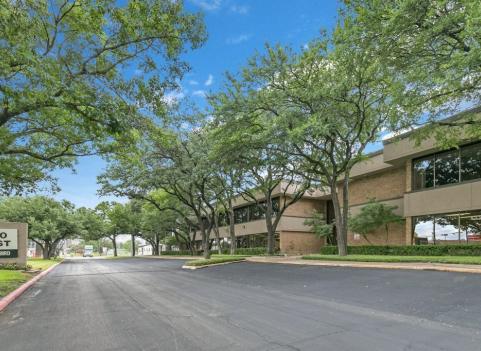
- • Enhanced landscaping
- • Secured and gated parking
- • Fiber available
- • Back-up genterators
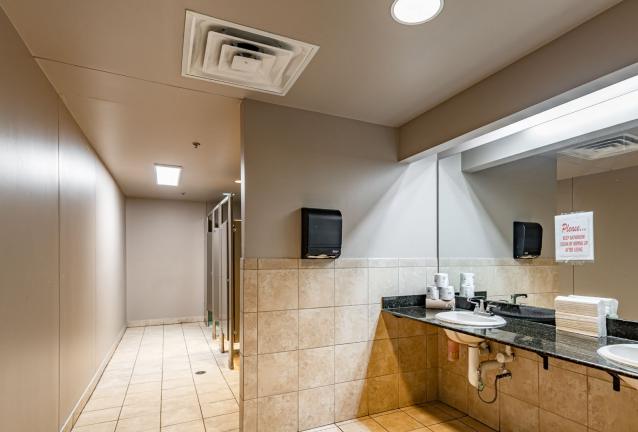
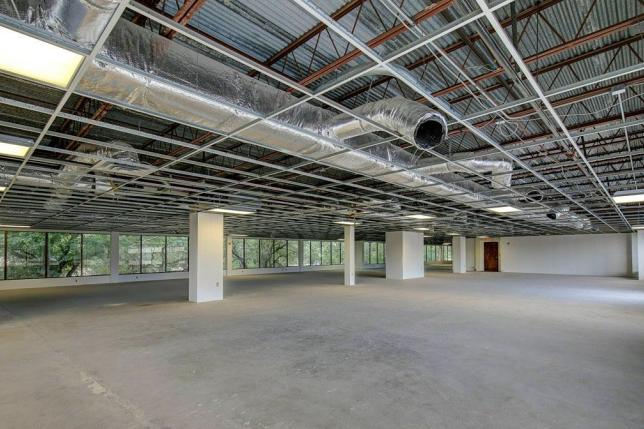
Additional Photos

Listing Agents

Chase Miller
O: 214-256-7131
M: 214-770-5495
cmiller@nairl.com
O: 214-256-7131
M: 214-770-5495
cmiller@nairl.com
Robert Blankinship
O: 214-256-7115
M: 214-500-6326
rblankinship@nairl.com
O: 214-256-7115
M: 214-500-6326
rblankinship@nairl.com
While we strive to provide the most accurate information, all listing information, and demographic data, is provided by third-parties. As such, MyEListing will not be responsible for the accuracy of the information. It is strongly recommended that you verify all information with the listing agent, and any relevant agencies, prior to making any decisions.