Retail Space
SWC Highway 249 and Millsview Rd Houston, TX 77070
SWC Highway 249 and Millsview Rd Houston, TX 77070

Details & Description
Property Highlights
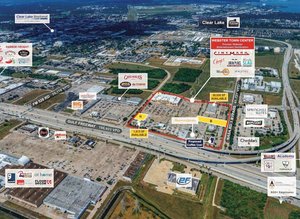
• Less than a mile from a Who’s Who of national restaurants, chain stores, and boutiques
• Less than 2 miles from Willowbrook Mall, which averages 5.7M shopper visits annually
Additional Photos


Listing Agents

Kevin Sims
O: 281-477-4366
ksims@newquest.com
O: 281-477-4366
ksims@newquest.com

Nick Ramsey
O: 281-477-4359
nramsey@newquest.com
O: 281-477-4359
nramsey@newquest.com
While we strive to provide the most accurate information, all listing information, and demographic data, is provided by third-parties. As such, MyEListing will not be responsible for the accuracy of the information. It is strongly recommended that you verify all information with the listing agent, and any relevant agencies, prior to making any decisions.