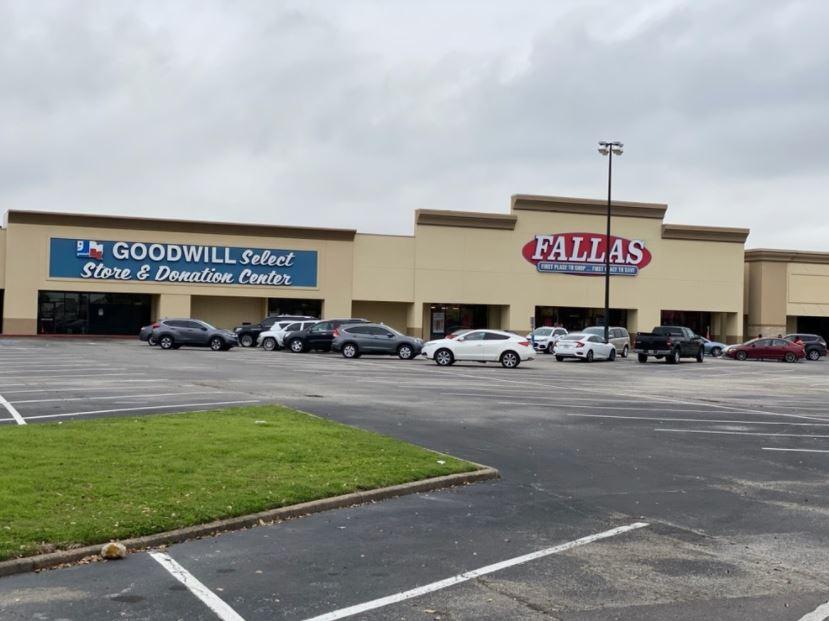
Retail Space
10703 Jones Road Houston, TX 77065
10703 Jones Road Houston, TX 77065
Details & Description
Property Highlights
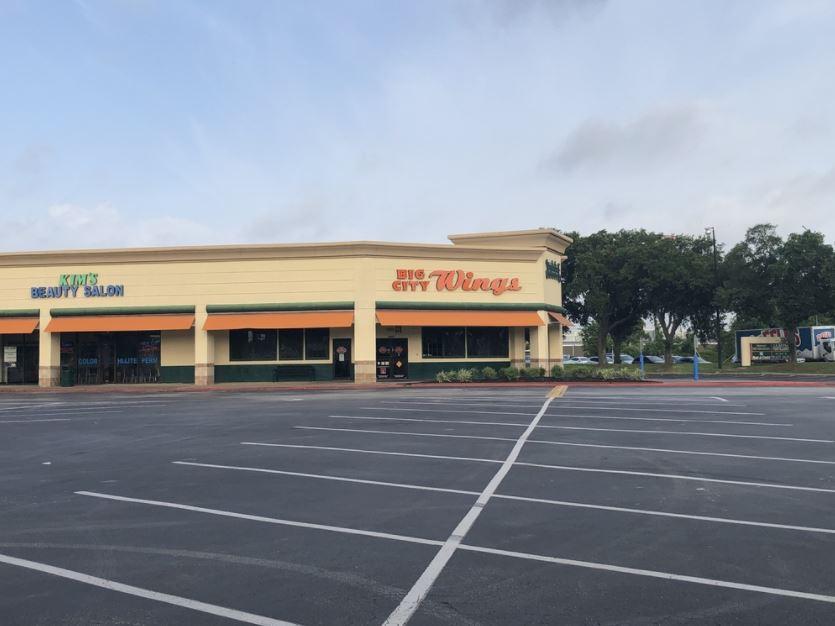
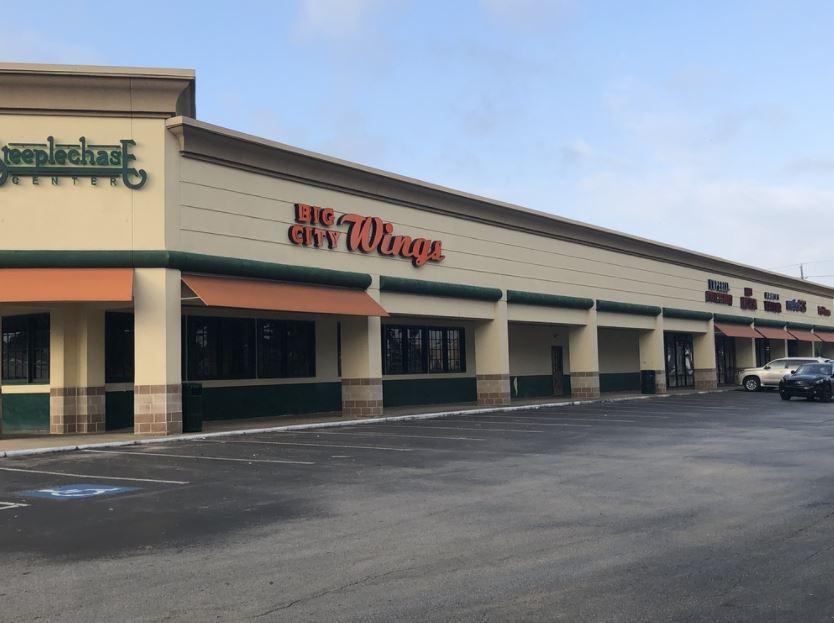
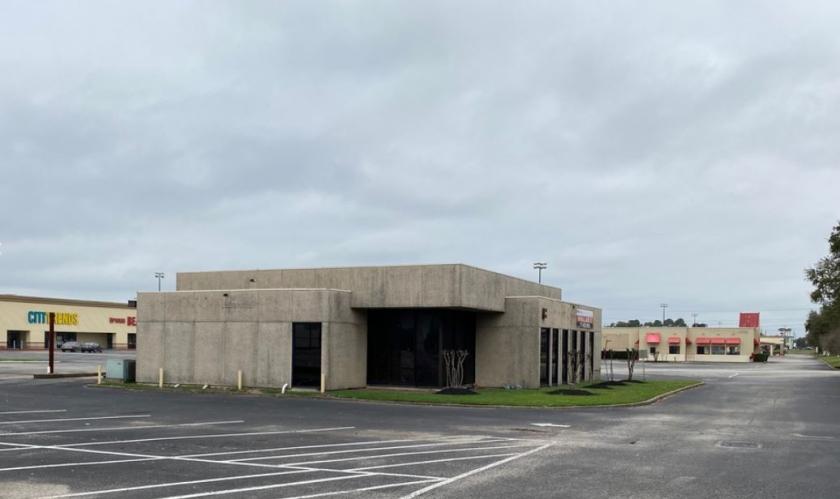
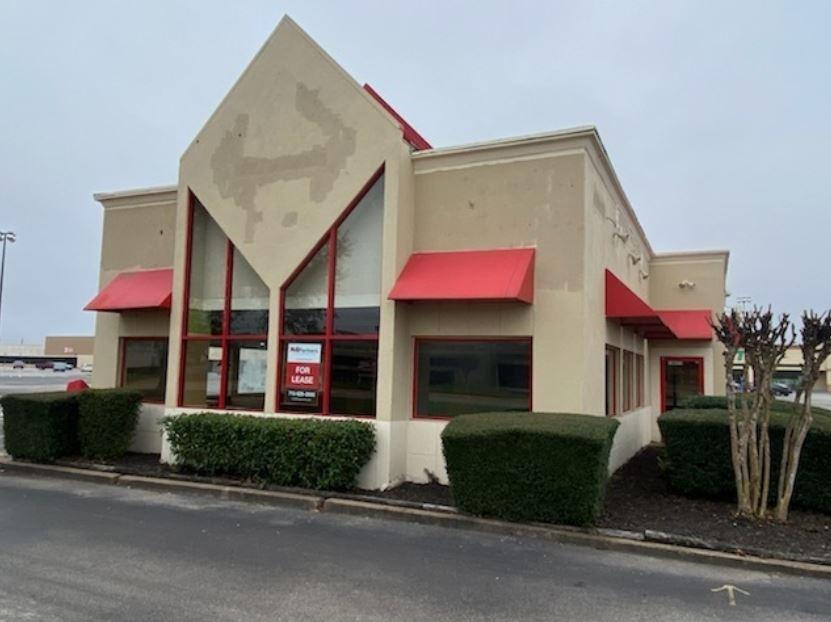
- • 2 Second-generation restaurant available
- • Landlord offering competitive finish-out allowance
- • Junior anchor space available
Additional Photos
Listing Agents

Shaffer Braun
O: 713-275-9653
M: 713-562-4006
shaffer.braun@partnersrealestate.com
O: 713-275-9653
M: 713-562-4006
shaffer.braun@partnersrealestate.com
While we strive to provide the most accurate information, all listing information, and demographic data, is provided by third-parties. As such, MyEListing will not be responsible for the accuracy of the information. It is strongly recommended that you verify all information with the listing agent, and any relevant agencies, prior to making any decisions.


