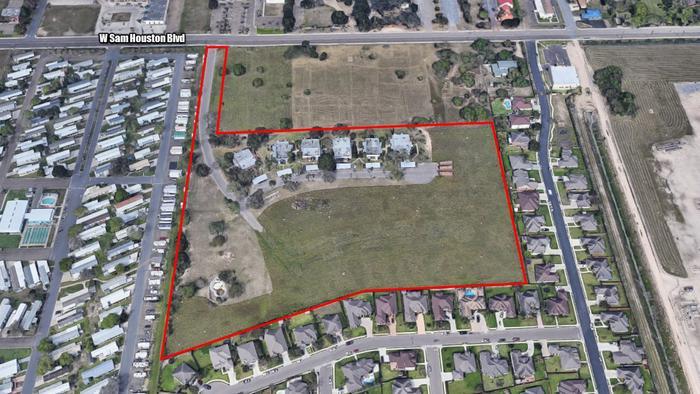
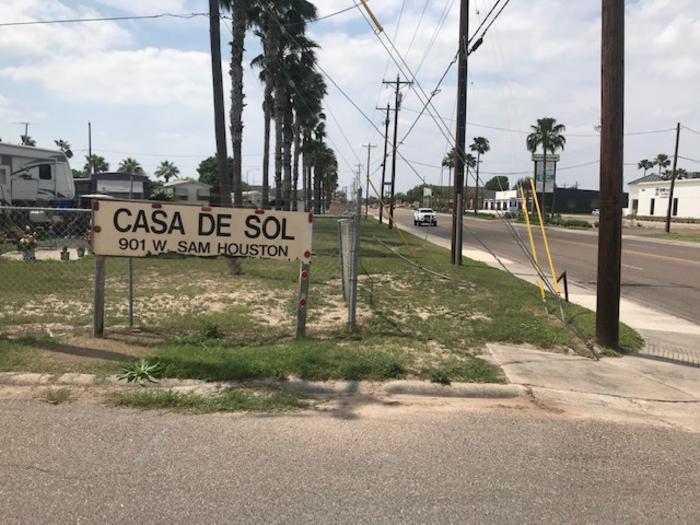
1-Mile | 3-Miles | 5-Miles | ||
---|---|---|---|---|
Total Population | 9,824 | 81,701 | 218,502 | |
Population Median Age | 36 | 35 | 34 | |
Population by Age | 0-9 Yrs | 1695 (17%) | 13990 (17%) | 37781 (17%) |
10-19 Yrs | 1657 (16%) | 12601 (15%) | 35300 (16%) | |
20-29 Yrs | 1197 (12%) | 11479 (14%) | 31434 (14%) | |
30-39 Yrs | 1173 (11%) | 10524 (12%) | 29124 (13%) | |
40-49 Yrs | 985 (10%) | 9180 (11%) | 26371 (12%) | |
50-59 Yrs | 1142 (11%) | 8115 (9%) | 19929 (9%) | |
60-69 Yrs | 684 (6%) | 6757 (8%) | 17677 (8%) | |
70+ Yrs | 1292 (13%) | 9055 (11%) | 20887 (9%) | |
Median HH Income | $40,838 | $40,232 | $39,408 | |
Total Household Income | < 24K | 941 (30%) | 8507 (33%) | 22435 (33%) |
25-49K | 1031 (33%) | 7093 (27%) | 17014 (25%) | |
50-74K | 568 (18%) | 4112 (16%) | 10535 (15%) | |
75-99K | 189 (6%) | 2265 (8%) | 6200 (9%) | |
100-199K | 315 (10%) | 3118 (12%) | 8209 (12%) | |
200K+ | 32 (1%) | 592 (2%) | 1836 (2%) | |
Highest Education Level | No Diploma | 1760 | 15185 | 42159 |
Diploma or GED | 1580 | 12479 | 29686 | |
Some College | 1177 | 9732 | 24202 | |
Assoc. Degree | 341 | 2554 | 6503 | |
Bachelors Degree | 761 | 7224 | 19254 | |
Higher Degree | 277 | 2670 | 7920 | |
Total Housing Units | 3,808 | 30,483 | 76,148 | |
--Owner-Occupied | 1,326 | 13,969 | 39,314 | |
--Renter-Occupied | 1,750 | 11,718 | 26,915 | |
Owner-Occupied Values | < 100K | 806 | 8136 | 21832 |
100-199K | 418 | 4332 | 13001 | |
200-299K | 70 | 851 | 2758 | |
300-399K | 9 | 320 | 985 | |
400-499K | 6 | 88 | 290 | |
500K+ | 17 | 242 | 447 | |
Total Working Age Population | 7,008 | 59,321 | 158,788 | |
In Work Force | 3,905 | 34,236 | 92,603 | |
Not In Work Force | 3,103 | 25,085 | 66,186 | |
Workforce Employed | 3,647 | 32,509 | 86,953 | |
Workforce Unemployed | 258 | 1,696 | 5,541 | |
Civlian Workforce | 3,905 | 34,205 | 92,494 | |
Military Workforce | 0 | 31 | 108 | |
Total Households | 3,076 | 25,687 | 66,229 | |
Family Households | 2,443 | 19,476 | 51,132 | |
Non-Family Households | 633 | 6,211 | 15,097 | |
Married Couple | 1,200 | 11,899 | 32,422 | |
Other Family | 1,243 | 7,577 | 18,710 | |
Married w/Child | 565 | 5,516 | 15,843 | |
Single Male w/Child | 41 | 370 | 968 | |
Single Female w/Child | 640 | 3,460 | 8,256 |
Population Change Last Two Decades - Plus Projection
2000 | % | 2010 | % | 2020 | % | 2030 | |
---|---|---|---|---|---|---|---|
Texas | 20,851,820 | +21 | 25,145,561 | +18 | 29,677,668 | +18 | 34,894,452 |
Hidalgo County | 569,463 | +36 | 774,769 | +12 | 870,366 | +10 | 956,044 |
Total Working Age Population:
Total Households:
Total Working Age Population:
Total Households:
Total Working Age Population:
Total Households: