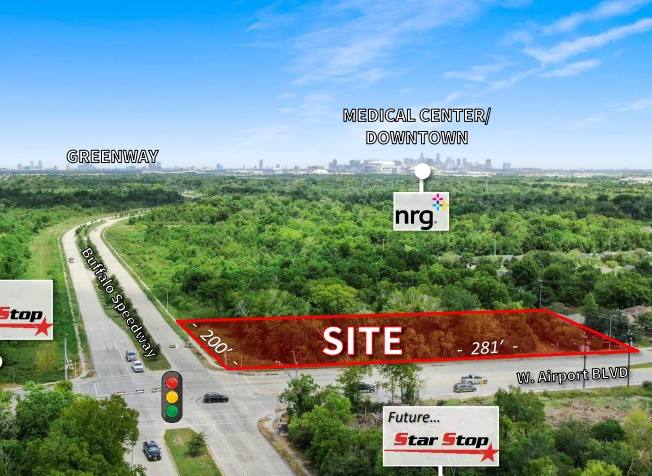
1-Mile | 3-Miles | 5-Miles | ||
---|---|---|---|---|
Total Population | 11,758 | 94,897 | 314,087 | |
Population Median Age | 33 | 34 | 36 | |
Population by Age | 0-9 Yrs | 1622 (13%) | 13866 (14%) | 44976 (14%) |
10-19 Yrs | 1857 (15%) | 13285 (13%) | 41983 (13%) | |
20-29 Yrs | 2340 (19%) | 15810 (16%) | 48686 (15%) | |
30-39 Yrs | 1416 (12%) | 14483 (15%) | 48218 (15%) | |
40-49 Yrs | 1553 (13%) | 12725 (13%) | 41825 (13%) | |
50-59 Yrs | 1562 (13%) | 10622 (11%) | 35504 (11%) | |
60-69 Yrs | 909 (7%) | 8718 (9%) | 28767 (9%) | |
70+ Yrs | 498 (4%) | 5389 (5%) | 24128 (7%) | |
Median HH Income | $70,681 | $59,291 | $59,878 | |
Total Household Income | < 24K | 514 (15%) | 5685 (17%) | 22676 (19%) |
25-49K | 405 (11%) | 7791 (23%) | 25830 (22%) | |
50-74K | 970 (28%) | 7490 (22%) | 22536 (19%) | |
75-99K | 720 (21%) | 4548 (13%) | 13439 (11%) | |
100-199K | 764 (22%) | 6188 (18%) | 20597 (17%) | |
200K+ | 26 (0%) | 1642 (4%) | 12104 (10%) | |
Highest Education Level | No Diploma | 1173 | 11530 | 30111 |
Diploma or GED | 2319 | 14552 | 42682 | |
Some College | 1930 | 11566 | 37291 | |
Assoc. Degree | 200 | 3741 | 11769 | |
Bachelors Degree | 771 | 10411 | 41455 | |
Higher Degree | 541 | 8699 | 41623 | |
Total Housing Units | 3,437 | 36,401 | 130,589 | |
--Owner-Occupied | 1,996 | 18,129 | 60,596 | |
--Renter-Occupied | 1,403 | 15,214 | 56,587 | |
Owner-Occupied Values | < 100K | 941 | 6037 | 15237 |
100-199K | 978 | 6425 | 18581 | |
200-299K | 51 | 2914 | 8098 | |
300-399K | 20 | 1346 | 4992 | |
400-499K | 6 | 784 | 3126 | |
500K+ | 0 | 623 | 10562 | |
Total Working Age Population | 9,138 | 72,886 | 242,924 | |
In Work Force | 6,046 | 49,651 | 159,018 | |
Not In Work Force | 3,092 | 23,236 | 83,906 | |
Workforce Employed | 5,417 | 45,959 | 147,804 | |
Workforce Unemployed | 629 | 3,691 | 11,183 | |
Civlian Workforce | 6,046 | 49,651 | 158,987 | |
Military Workforce | 0 | 0 | 31 | |
Total Households | 3,399 | 33,344 | 117,182 | |
Family Households | 2,709 | 21,805 | 72,691 | |
Non-Family Households | 689 | 11,539 | 44,492 | |
Married Couple | 1,155 | 12,317 | 45,600 | |
Other Family | 1,554 | 9,487 | 27,090 | |
Married w/Child | 440 | 6,067 | 22,150 | |
Single Male w/Child | 101 | 789 | 2,720 | |
Single Female w/Child | 497 | 3,324 | 10,209 |
Population Change Last Two Decades - Plus Projection
2000 | % | 2010 | % | 2020 | % | 2030 | |
---|---|---|---|---|---|---|---|
Texas | 20,851,820 | +21 | 25,145,561 | +18 | 29,677,668 | +18 | 34,894,452 |
Fort Bend County | 354,452 | +65 | 585,375 | +44 | 840,383 | +43 | 1,203,029 |
Harris County | 3,400,578 | +20 | 4,092,459 | +22 | 4,978,845 | +19 | 5,924,750 |
Brazoria County | 241,767 | +30 | 313,166 | +20 | 375,869 | +20 | 452,517 |
Total Working Age Population:
Total Households:
Total Working Age Population:
Total Households:
Total Working Age Population:
Total Households: