Commercial Land
423 East University Drive West McKinney, TX 75069
423 East University Drive West McKinney, TX 75069
Details & Description
Property Highlights
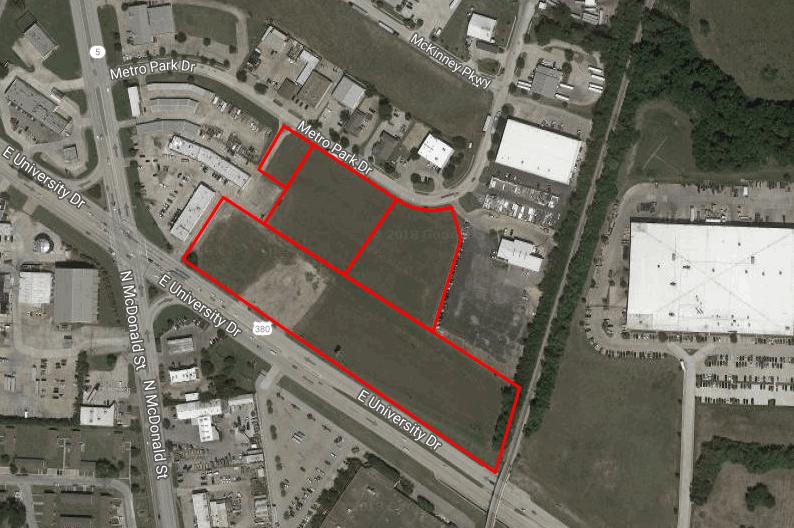
• Great Site for: Retail Center, QSR, Restaurant, Auto, etc.
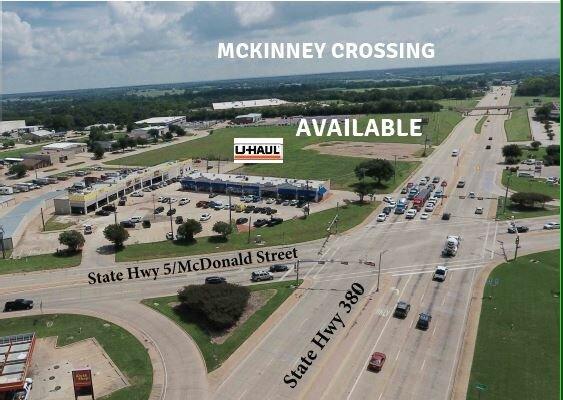
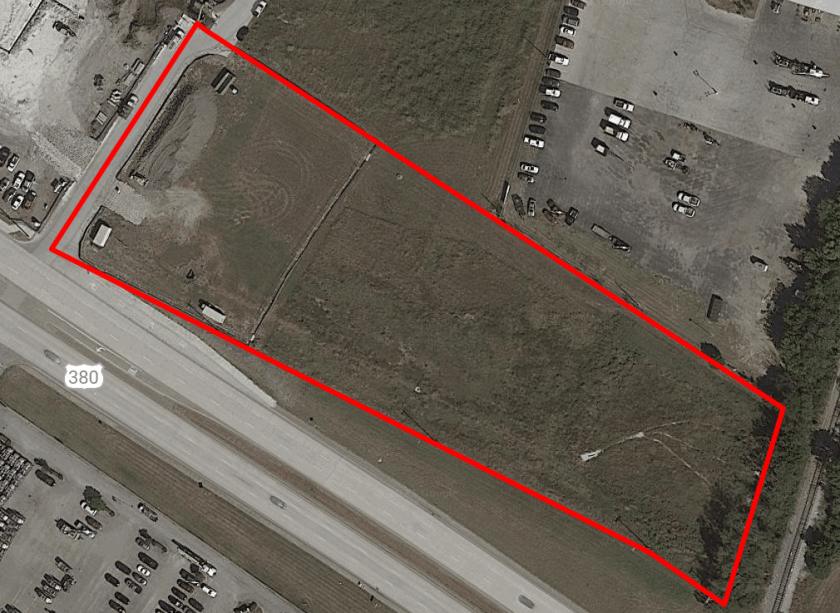
• Located at the NEC of US 380 and Highway 5 in McKinney
Listing Agents

Kara Porter
O: 972-250-5860
M: 214-789-6898
kporter@capstonecommercial.com
O: 972-250-5860
M: 214-789-6898
kporter@capstonecommercial.com
While we strive to provide the most accurate information, all listing information, and demographic data, is provided by third-parties. As such, MyEListing will not be responsible for the accuracy of the information. It is strongly recommended that you verify all information with the listing agent, and any relevant agencies, prior to making any decisions.