Commercial Land
301 U.S. 287 Decatur, TX 76234
301 U.S. 287 Decatur, TX 76234
Details & Description
Property Highlights
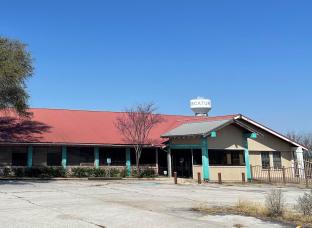
- • 5,720 SF Former Restaurant on Property
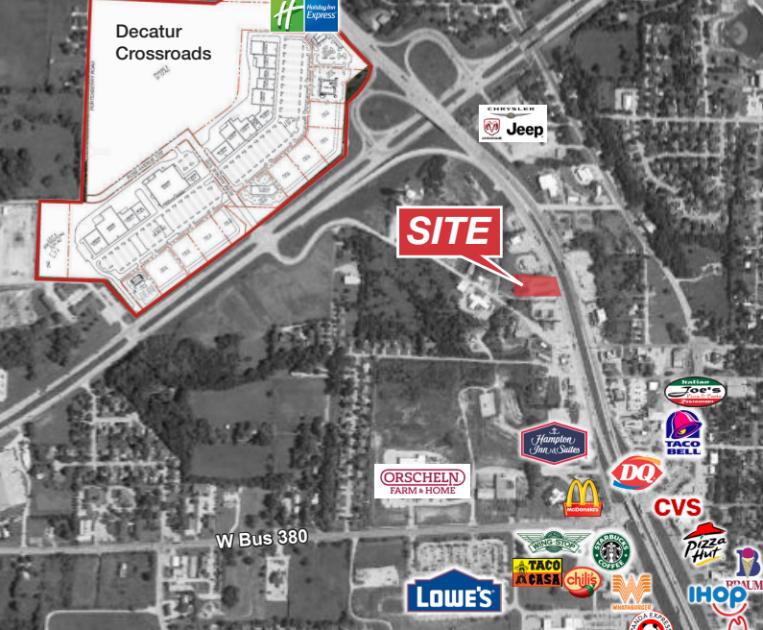
- • Conveniently Located Off Highway 287
- • Utilities On-Site
- • C-2 Commercial Zoning
Additional Photos


Listing Agents

Justin Glover
O: 817-872-3921
M: 832-630-8003
jglover@nairl.com
O: 817-872-3921
M: 832-630-8003
jglover@nairl.com
While we strive to provide the most accurate information, all listing information, and demographic data, is provided by third-parties. As such, MyEListing will not be responsible for the accuracy of the information. It is strongly recommended that you verify all information with the listing agent, and any relevant agencies, prior to making any decisions.


