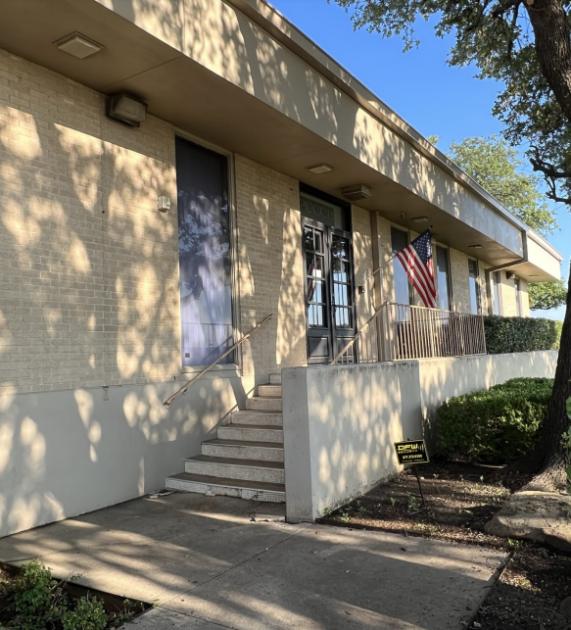
Industrial Properties
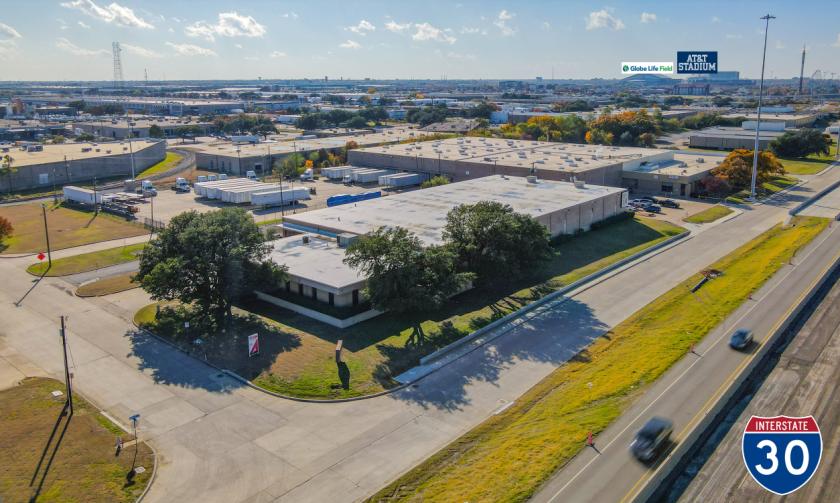
925 111th Street Arlington, TX 76011
925 111th Street Arlington, TX 76011
Details & Description
Property Highlights
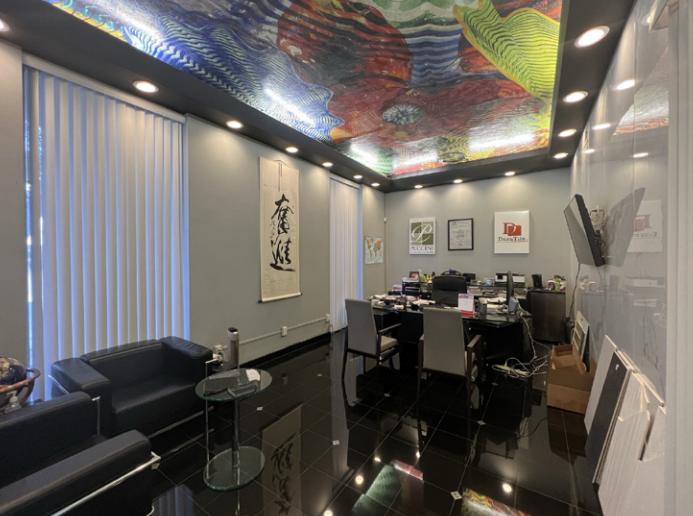
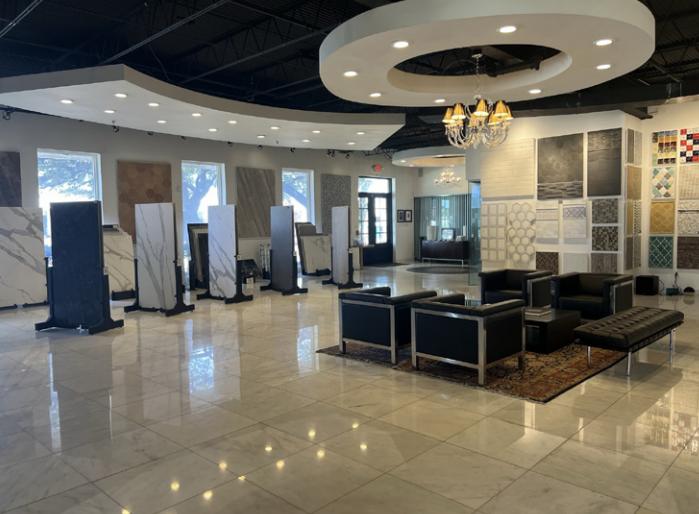
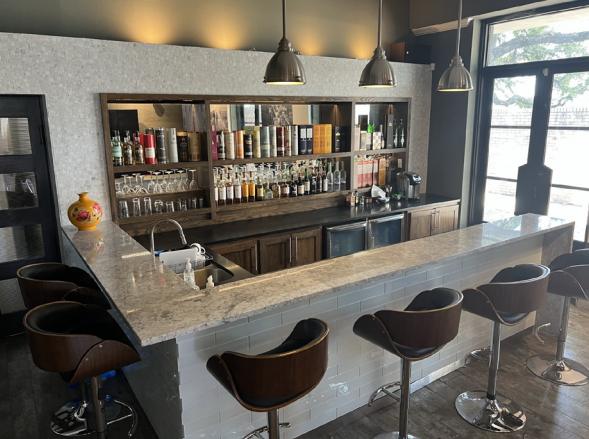
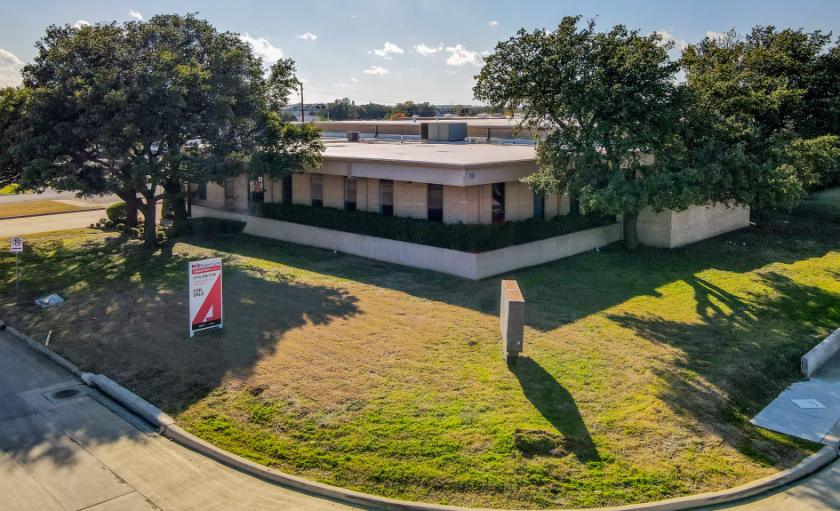
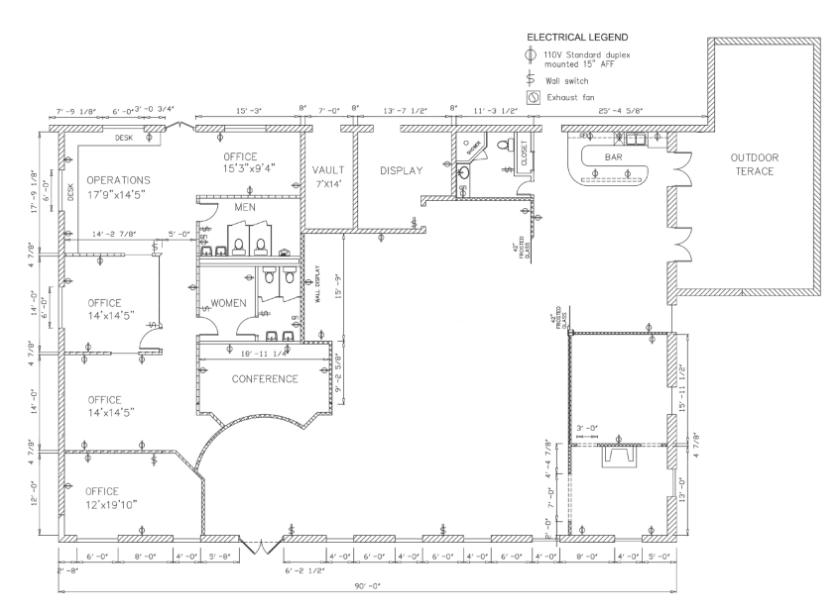
- • 5,400 SF Office
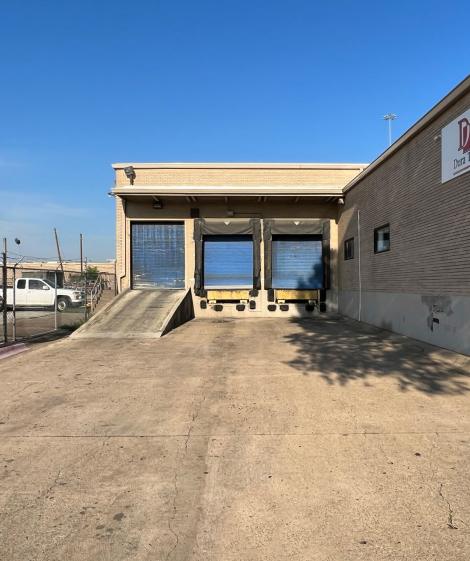
- • 16’ Clear Height
- • LED Lighting and Sprinklered
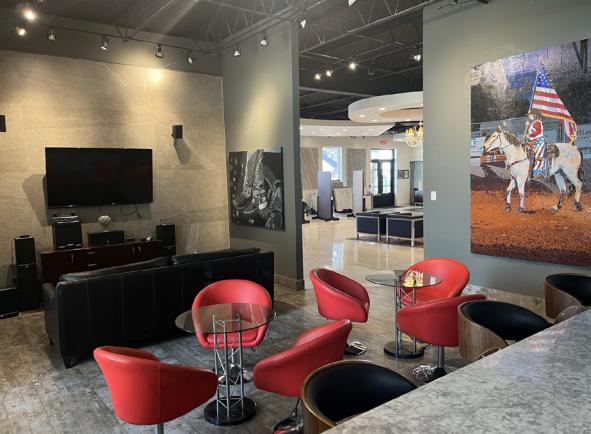
- • Outdoor Terrace
- • 113’ Truck Court and 43 Car Parks
- • Monument Sign Facing I-30
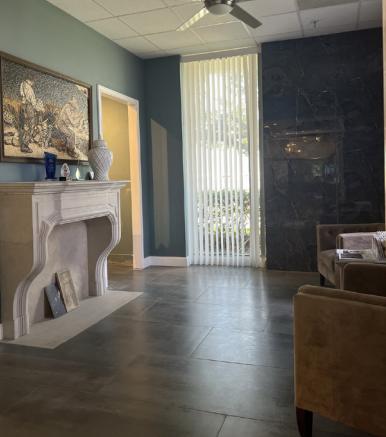
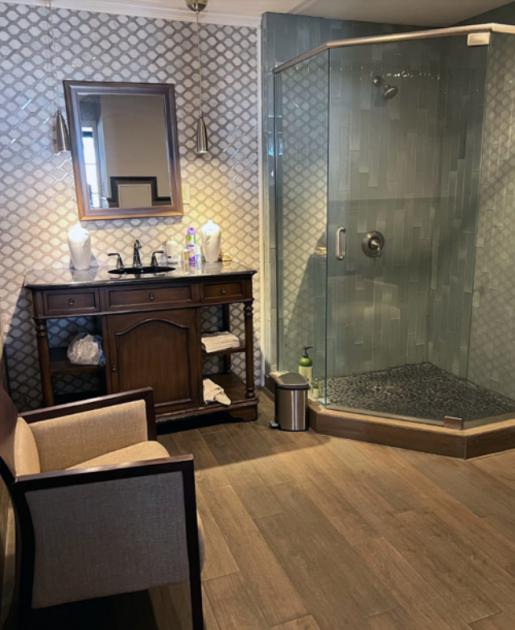
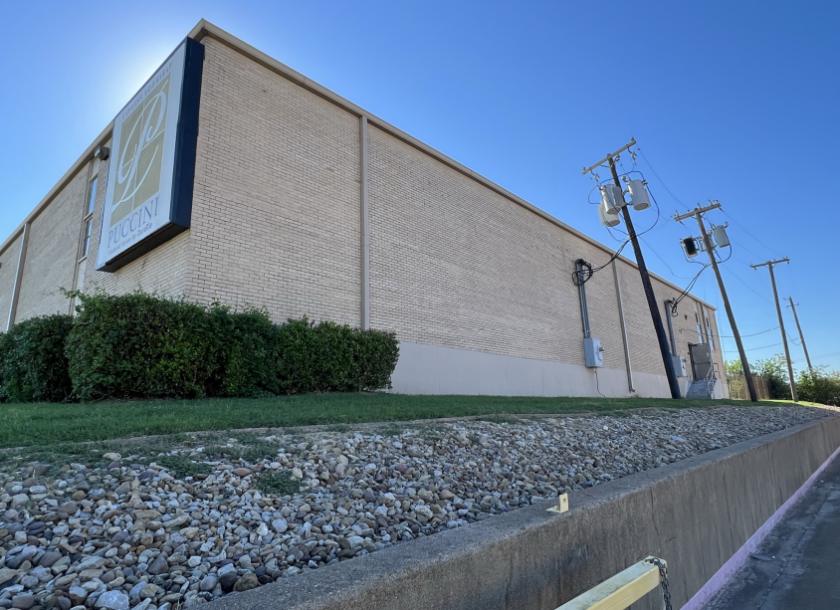
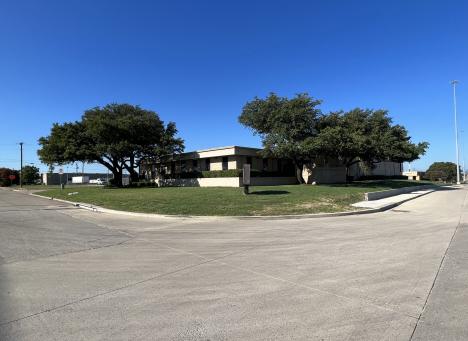
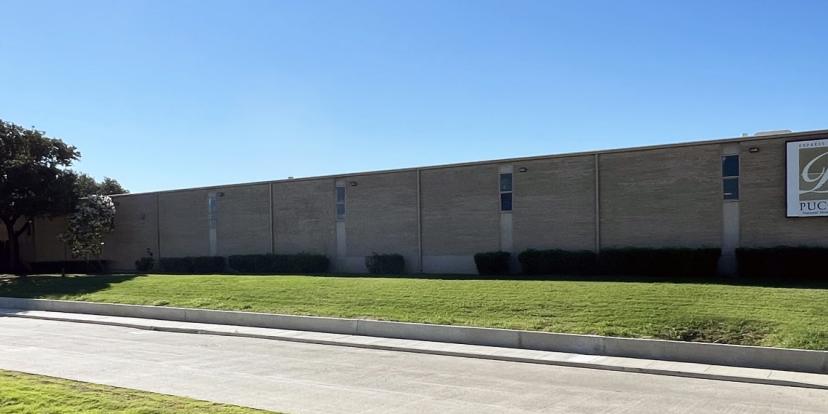
Additional Photos

Listing Agents

Michael Stanzel
O: 214-256-7122
M: 214-460-6085
mstanzel@nairl.com
O: 214-256-7122
M: 214-460-6085
mstanzel@nairl.com

Adam Brown
O: 214-256-7132
M: 662-871-6948
abrown@nairl.com
O: 214-256-7132
M: 662-871-6948
abrown@nairl.com
While we strive to provide the most accurate information, all listing information, and demographic data, is provided by third-parties. As such, MyEListing will not be responsible for the accuracy of the information. It is strongly recommended that you verify all information with the listing agent, and any relevant agencies, prior to making any decisions.