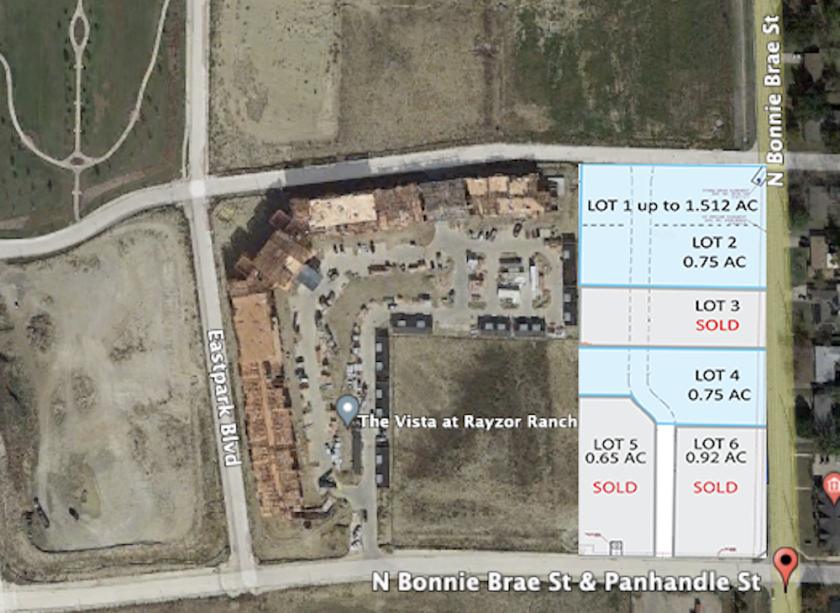
1-Mile | 3-Miles | 5-Miles | ||
---|---|---|---|---|
Total Population | 8,465 | 59,331 | 109,318 | |
Population Median Age | 31 | 31 | 33 | |
Population by Age | 0-9 Yrs | 631 (7%) | 4949 (8%) | 11342 (10%) |
10-19 Yrs | 1600 (18%) | 9636 (16%) | 15822 (14%) | |
20-29 Yrs | 3134 (37%) | 21483 (36%) | 31761 (29%) | |
30-39 Yrs | 1084 (12%) | 7922 (13%) | 14752 (13%) | |
40-49 Yrs | 469 (5%) | 4406 (7%) | 10494 (9%) | |
50-59 Yrs | 601 (7%) | 4411 (7%) | 9997 (9%) | |
60-69 Yrs | 307 (3%) | 3048 (5%) | 7607 (6%) | |
70+ Yrs | 639 (7%) | 3476 (5%) | 7542 (6%) | |
Median HH Income | $29,888 | $42,192 | $54,186 | |
Total Household Income | < 24K | 1361 (41%) | 5878 (28%) | 8537 (22%) |
25-49K | 924 (28%) | 5836 (28%) | 9411 (24%) | |
50-74K | 290 (8%) | 3536 (17%) | 6597 (17%) | |
75-99K | 226 (6%) | 2443 (11%) | 5099 (13%) | |
100-199K | 380 (11%) | 2607 (12%) | 6955 (18%) | |
200K+ | 65 (2%) | 376 (1%) | 1594 (4%) | |
Highest Education Level | No Diploma | 191 | 2903 | 5868 |
Diploma or GED | 706 | 5781 | 11642 | |
Some College | 1174 | 7908 | 16047 | |
Assoc. Degree | 294 | 1971 | 4667 | |
Bachelors Degree | 917 | 7334 | 15315 | |
Higher Degree | 711 | 4828 | 8998 | |
Total Housing Units | 3,778 | 23,448 | 42,289 | |
--Owner-Occupied | 948 | 6,181 | 16,339 | |
--Renter-Occupied | 2,298 | 14,494 | 21,853 | |
Owner-Occupied Values | < 100K | 80 | 815 | 1651 |
100-199K | 467 | 2784 | 5541 | |
200-299K | 308 | 1981 | 5990 | |
300-399K | 53 | 362 | 2022 | |
400-499K | 27 | 121 | 423 | |
500K+ | 13 | 119 | 713 | |
Total Working Age Population | 7,645 | 52,373 | 92,292 | |
In Work Force | 5,043 | 34,818 | 62,609 | |
Not In Work Force | 2,602 | 17,554 | 29,683 | |
Workforce Employed | 4,683 | 32,628 | 59,116 | |
Workforce Unemployed | 356 | 2,123 | 3,427 | |
Civlian Workforce | 5,039 | 34,752 | 62,542 | |
Military Workforce | 4 | 67 | 67 | |
Total Households | 3,246 | 20,676 | 38,192 | |
Family Households | 950 | 8,632 | 20,792 | |
Non-Family Households | 2,296 | 12,043 | 17,400 | |
Married Couple | 619 | 5,951 | 14,568 | |
Other Family | 331 | 2,682 | 6,224 | |
Married w/Child | 276 | 2,240 | 6,172 | |
Single Male w/Child | 70 | 224 | 644 | |
Single Female w/Child | 116 | 944 | 2,231 |
Population Change Last Two Decades - Plus Projection
2000 | % | 2010 | % | 2020 | % | 2030 | |
---|---|---|---|---|---|---|---|
Texas | 20,851,820 | +21 | 25,145,561 | +18 | 29,677,668 | +18 | 34,894,452 |
Denton County | 432,976 | +53 | 662,614 | +36 | 897,953 | +37 | 1,234,110 |
Total Working Age Population:
Total Households:
Total Working Age Population:
Total Households:
Total Working Age Population:
Total Households: