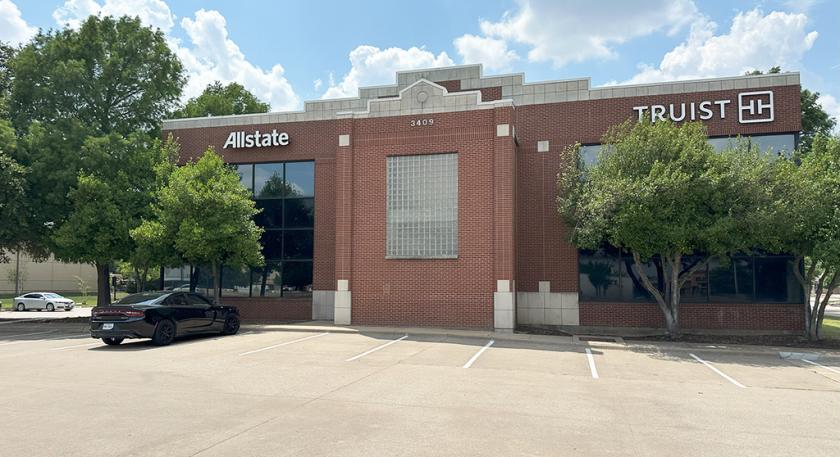
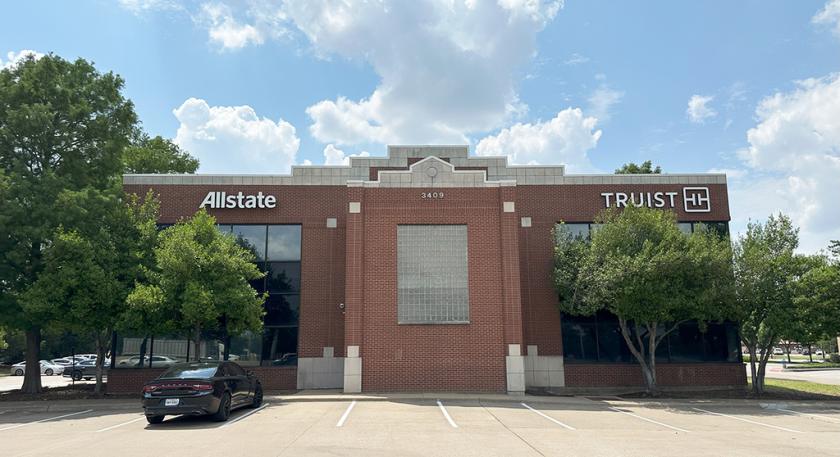
Office Space
3409 North Central Expressway Plano, TX 75074
3409 North Central Expressway Plano, TX 75074

Details & Description
Property Highlights
• 3409 N Central Expy is a prime office location in North Plano with easy access off US-75 to Parker Rd and Park Blvd
• The office is highly visible site to US-75 with a traffic count of nearly 250,000 VPD
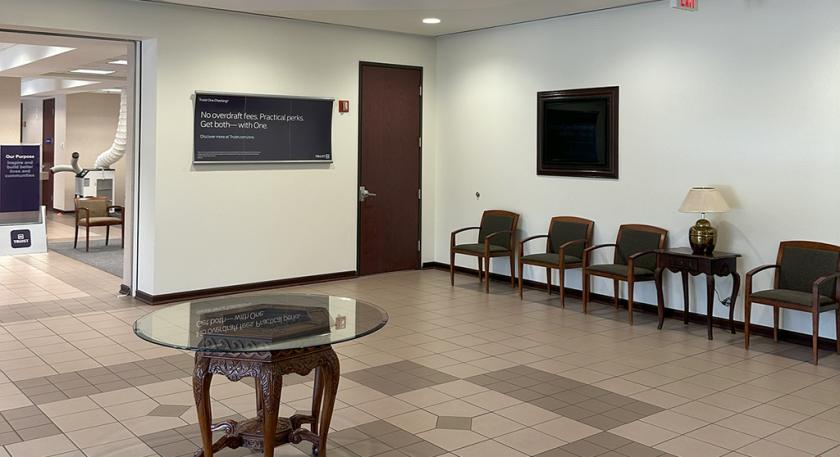
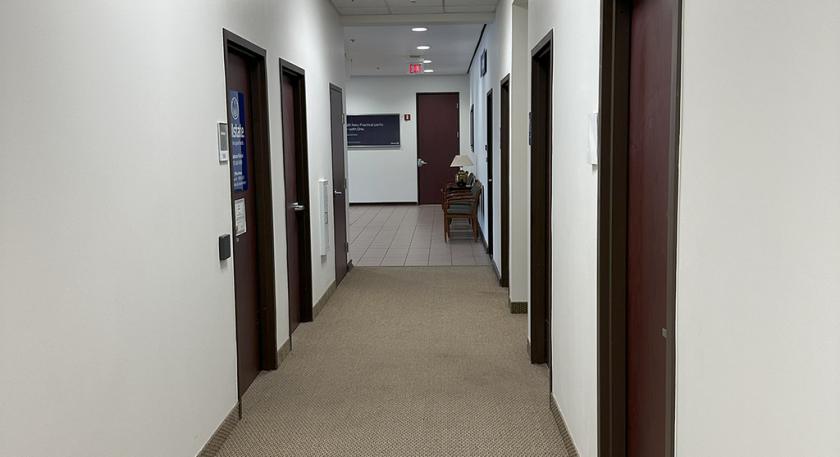
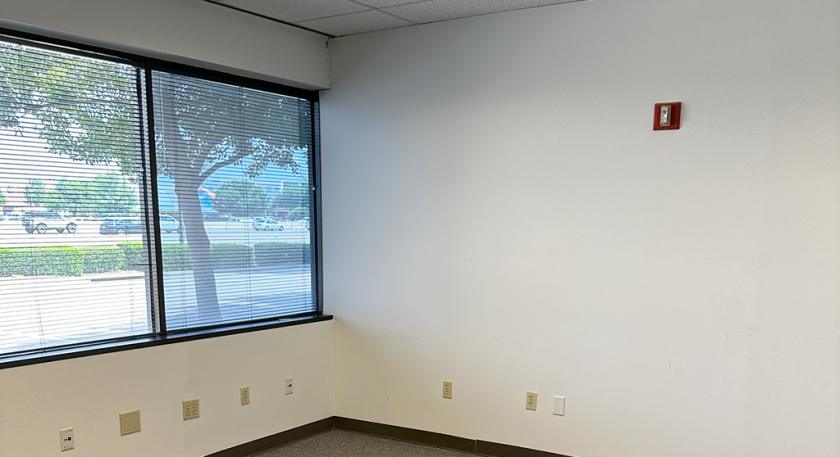
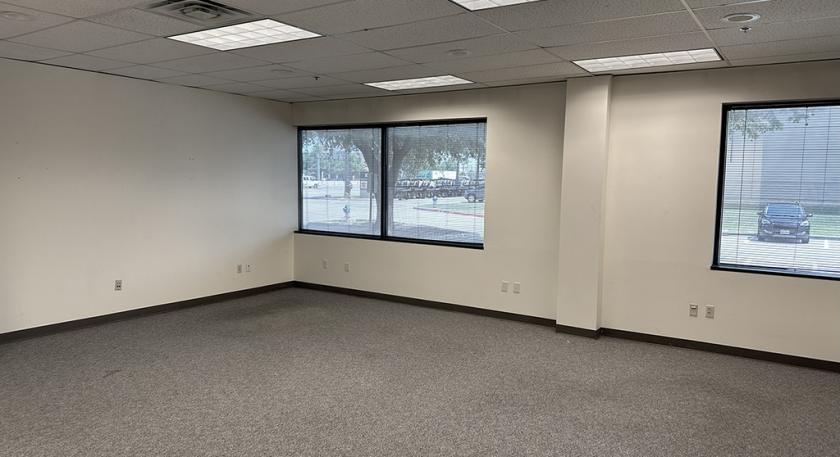
Additional Photos
Listing Agents

Jared Laake
O: 972-776-7045
jlaake@bradford.com
O: 972-776-7045
jlaake@bradford.com

Erik Blais
O: 817-921-8179
M: 972-955-2391
eblais@bradford.com
O: 817-921-8179
M: 972-955-2391
eblais@bradford.com
While we strive to provide the most accurate information, all listing information, and demographic data, is provided by third-parties. As such, MyEListing will not be responsible for the accuracy of the information. It is strongly recommended that you verify all information with the listing agent, and any relevant agencies, prior to making any decisions.