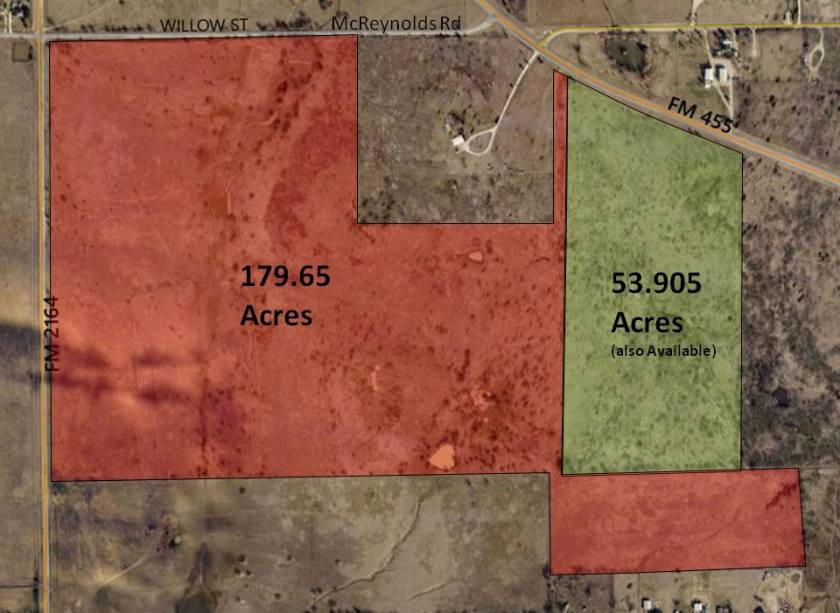
1-Mile | 3-Miles | 5-Miles | ||
---|---|---|---|---|
Total Population | 512 | 3,939 | 13,784 | |
Population Median Age | 36 | 37 | 36 | |
Population by Age | 0-9 Yrs | 66 (12%) | 498 (12%) | 2037 (14%) |
10-19 Yrs | 84 (16%) | 626 (15%) | 1893 (13%) | |
20-29 Yrs | 59 (11%) | 461 (11%) | 2002 (14%) | |
30-39 Yrs | 73 (14%) | 557 (14%) | 1935 (14%) | |
40-49 Yrs | 93 (18%) | 701 (17%) | 2051 (14%) | |
50-59 Yrs | 53 (10%) | 427 (10%) | 1487 (10%) | |
60-69 Yrs | 38 (7%) | 328 (8%) | 1253 (9%) | |
70+ Yrs | 46 (8%) | 341 (8%) | 1124 (8%) | |
Median HH Income | $70,723 | $70,821 | $73,966 | |
Total Household Income | < 24K | 16 (9%) | 124 (9%) | 459 (10%) |
25-49K | 36 (22%) | 275 (21%) | 897 (20%) | |
50-74K | 34 (21%) | 284 (22%) | 875 (19%) | |
75-99K | 21 (13%) | 174 (13%) | 521 (11%) | |
100-199K | 41 (25%) | 332 (25%) | 1372 (31%) | |
200K+ | 12 (7%) | 91 (7%) | 271 (6%) | |
Highest Education Level | No Diploma | 39 | 290 | 1197 |
Diploma or GED | 104 | 752 | 2390 | |
Some College | 84 | 633 | 1959 | |
Assoc. Degree | 22 | 176 | 694 | |
Bachelors Degree | 70 | 548 | 1675 | |
Higher Degree | 19 | 203 | 897 | |
Total Housing Units | 169 | 1,364 | 4,722 | |
--Owner-Occupied | 118 | 921 | 3,166 | |
--Renter-Occupied | 44 | 360 | 1,228 | |
Owner-Occupied Values | < 100K | 18 | 133 | 418 |
100-199K | 28 | 185 | 1063 | |
200-299K | 48 | 384 | 1007 | |
300-399K | 15 | 125 | 322 | |
400-499K | 6 | 59 | 164 | |
500K+ | 3 | 35 | 193 | |
Total Working Age Population | 384 | 2,994 | 10,550 | |
In Work Force | 277 | 2,133 | 7,258 | |
Not In Work Force | 107 | 861 | 3,292 | |
Workforce Employed | 273 | 2,079 | 7,023 | |
Workforce Unemployed | 4 | 54 | 236 | |
Civlian Workforce | 277 | 2,133 | 7,258 | |
Military Workforce | 0 | 0 | 0 | |
Total Households | 161 | 1,281 | 4,395 | |
Family Households | 123 | 977 | 3,328 | |
Non-Family Households | 38 | 304 | 1,066 | |
Married Couple | 93 | 741 | 2,605 | |
Other Family | 30 | 236 | 724 | |
Married w/Child | 47 | 352 | 1,214 | |
Single Male w/Child | 2 | 25 | 166 | |
Single Female w/Child | 11 | 91 | 277 |
Population Change Last Two Decades - Plus Projection
2000 | % | 2010 | % | 2020 | % | 2030 | |
---|---|---|---|---|---|---|---|
Texas | 20,851,820 | +21 | 25,145,561 | +18 | 29,677,668 | +18 | 34,894,452 |
Denton County | 432,976 | +53 | 662,614 | +36 | 897,953 | +37 | 1,234,110 |
Cooke County | 36,363 | +6 | 38,437 | +3 | 39,727 | +2 | 40,626 |
Total Working Age Population:
Total Households:
Total Working Age Population:
Total Households:
Total Working Age Population:
Total Households: