Location
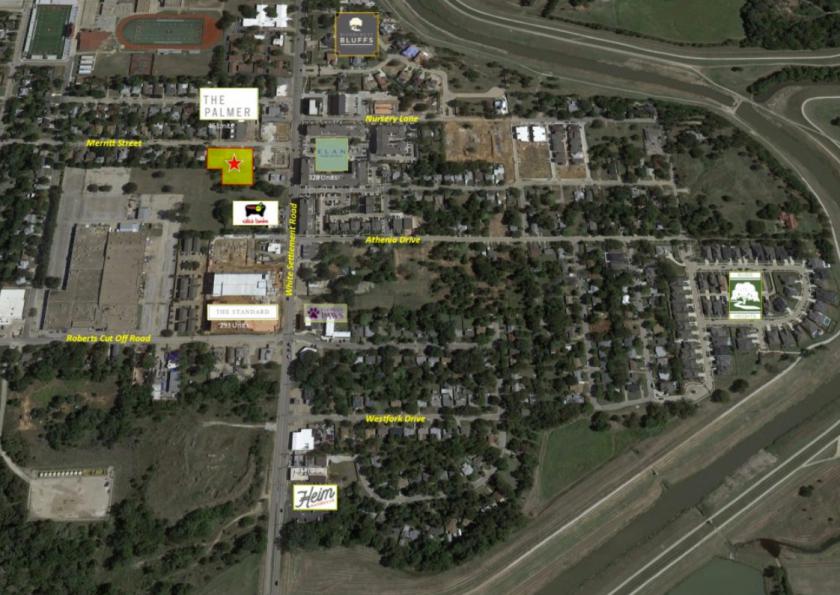
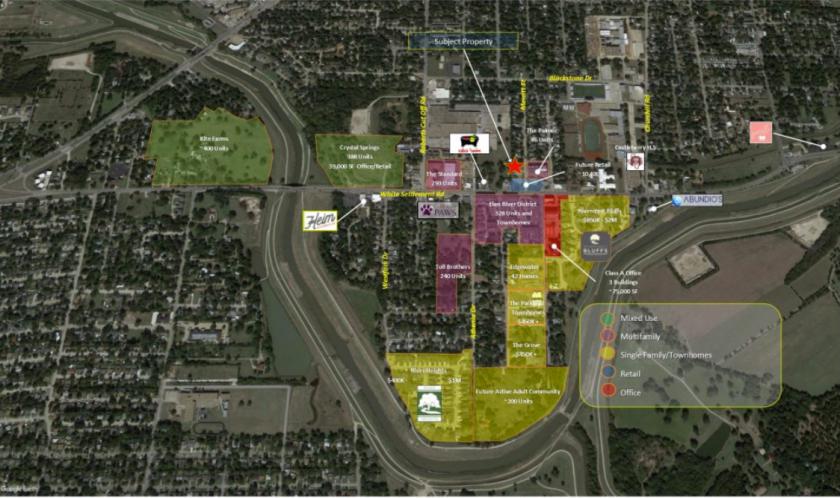
Infill redevelopment site in the heart of the River District, a vibrant and upscale mixed-use neighborhood in west Fort Worth. The site offers excellent visibility and access to White Settlement Road, the primary east-west thoroughfare into the W. 7th district and downtown Fort Worth.
Property Features
- Total Land Area (3 Parcels): 1.13 AC (49,306 SF)
- Zoning: "MU-1" (Low Intensity Mixed - Use) and "B" (Two - Family)
- 223’ Frontage Along Merritt Street Offers Excellent Visibility From White Settlement Road
- All Utilities Available to the Site
- Walking Distance to Over 1,700 Built or Planned Multifamily Residential Units and Entertainment Options
No part of this information may be copied, reproduced, repurposed, or screen-captured for any commercial purpose without prior written authorization from MyEListing.
While we strive to provide the most accurate information, all listing information, and demographic data, is provided by third-parties. As such, MyEListing will not be responsible for the accuracy of the information. It is strongly recommended that you verify all information with the listing agent, and any relevant agencies, prior to making any decisions.
What is the asking price for 129 Merritt Street in Fort Worth?
The asking price for 129 Merritt Street is $1,250,000
How much land does the Fort Worth, TX property at 129 Merritt Street include?
129 Merritt Street in Fort Worth includes 1.130 acres of land
What is the population within 1 mile of 129 Merritt Street in Fort Worth?
The population within 1 mile of 129 Merritt Street Fort Worth, TX 76114 is 9,476 people.
Who do I contact for questions about 129 Merritt Street?
You should contact the listing agent,
Sarah LanCarte, for any details regarding this commercial listing.