Office Space
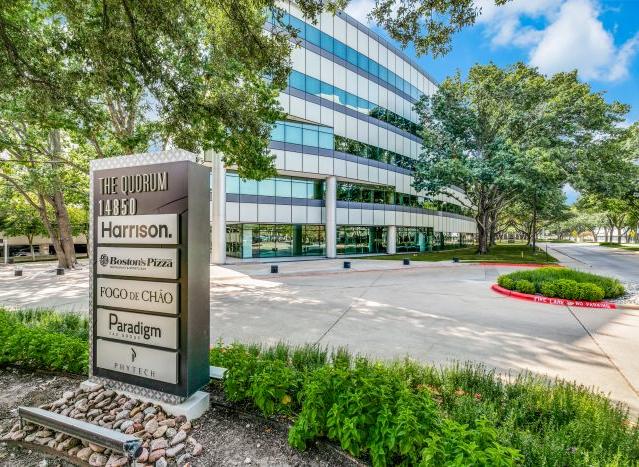
14850 Quorum Drive Dallas, TX 75254
14850 Quorum Drive Dallas, TX 75254
Details & Description
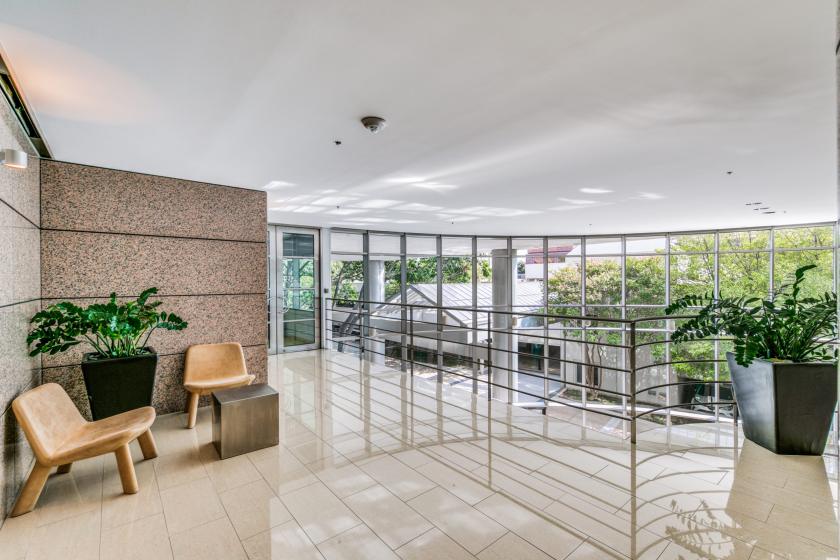
Additional Photos


Listing Agents

Tabitha Layne
O: 972-284-1026
tabitha.layne@sunwest-re.com
O: 972-284-1026
tabitha.layne@sunwest-re.com

Kellie Krautter
O: 972-284-1029
kellie.krautter@sunwest-re.com
O: 972-284-1029
kellie.krautter@sunwest-re.com
While we strive to provide the most accurate information, all listing information, and demographic data, is provided by third-parties. As such, MyEListing will not be responsible for the accuracy of the information. It is strongly recommended that you verify all information with the listing agent, and any relevant agencies, prior to making any decisions.


