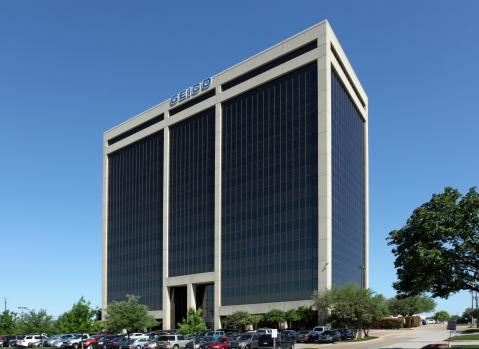
Office Space
4100 Spring Valley Road Farmers Branch, TX 75244
4100 Spring Valley Road Farmers Branch, TX 75244
Details & Description
Property Highlights
- • Suite 840 - Sublease Through: February 28, 2026
- • Covered Parking
- • 24-Hour Badge Access
- • Free Shared Conference Room
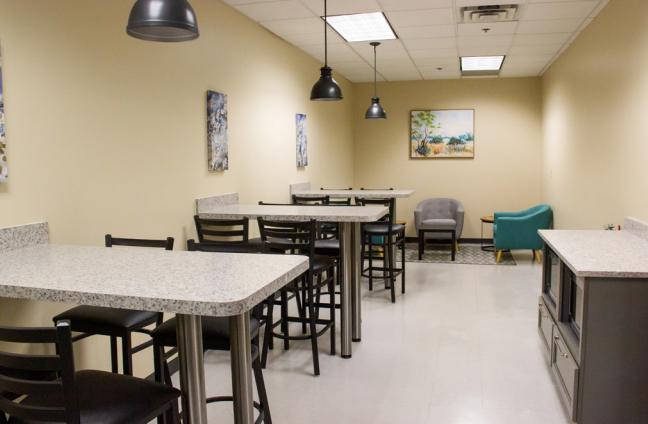
- • Coffee Bar
- • On-Site Deli
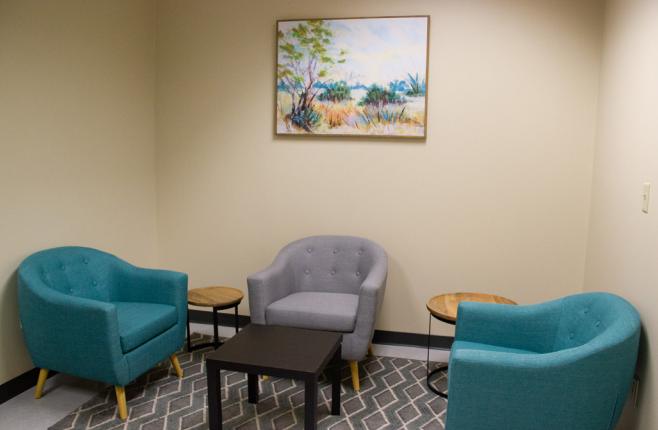
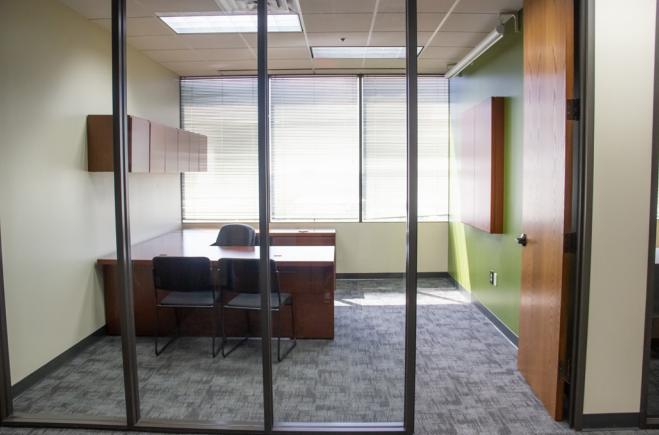
Additional Photos

Listing Agents

Nick Lee
O: 214-256-7121
M: 214-927-0487
nlee@nairl.com
O: 214-256-7121
M: 214-927-0487
nlee@nairl.com

Walker Hume
O: 214-256-7153
M: 214-205-7102
whume@nairl.com
O: 214-256-7153
M: 214-205-7102
whume@nairl.com
While we strive to provide the most accurate information, all listing information, and demographic data, is provided by third-parties. As such, MyEListing will not be responsible for the accuracy of the information. It is strongly recommended that you verify all information with the listing agent, and any relevant agencies, prior to making any decisions.