Industrial Properties
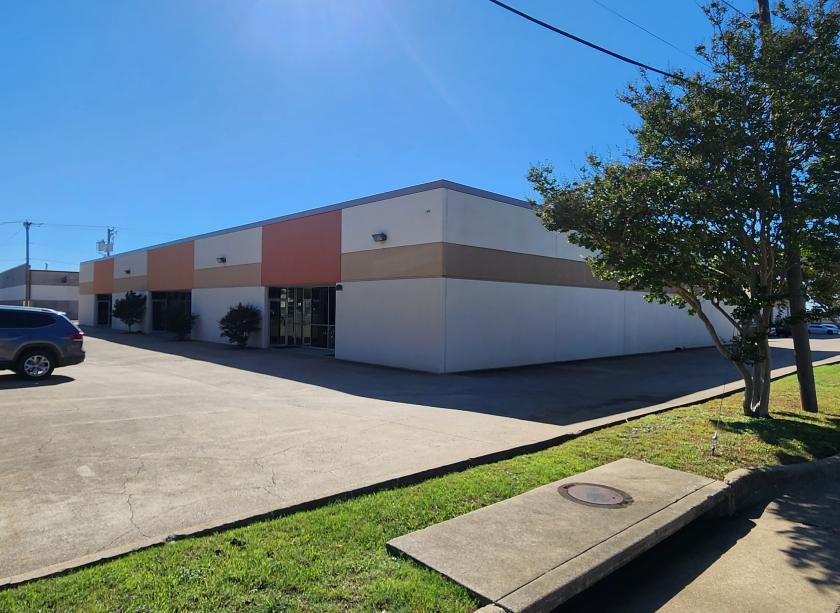
13777 Bee Street- Suite 180 Farmers Branch, TX 75234
13777 Bee Street- Suite 180 Farmers Branch, TX 75234
Details & Description
Property Highlights
- • Easy Freeway access
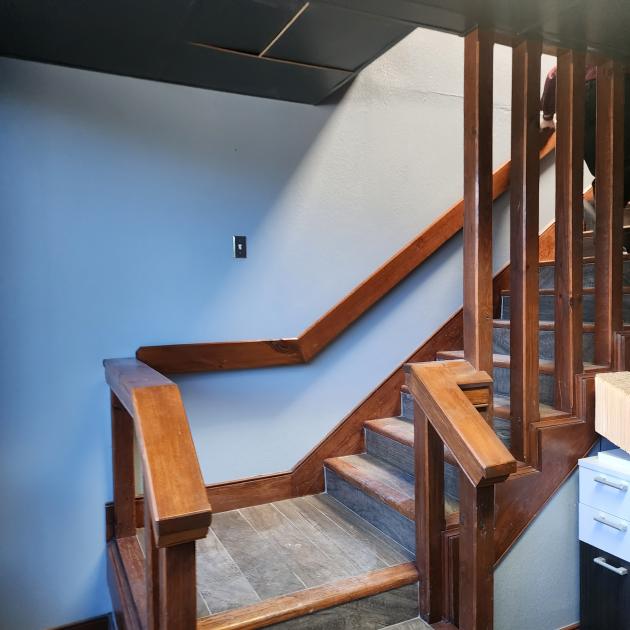
- • Natural Lighting
- • Front Loading
- • Grade Level and Dock High Access
- • Multi-Tenant Building on 2 Acres
- • Built in 1982
Listing Agents

Stephan Harris
O: 214-575-8848
sharris@cmirealestate.com
O: 214-575-8848
sharris@cmirealestate.com

Trent Vacek
O: 713-961-4666
tvacek@cmirealestate.com
O: 713-961-4666
tvacek@cmirealestate.com
While we strive to provide the most accurate information, all listing information, and demographic data, is provided by third-parties. As such, MyEListing will not be responsible for the accuracy of the information. It is strongly recommended that you verify all information with the listing agent, and any relevant agencies, prior to making any decisions.