Industrial Properties
4545 Spring Valley Road Farmers Branch, TX 75244
4545 Spring Valley Road Farmers Branch, TX 75244

Details & Description
Property Highlights
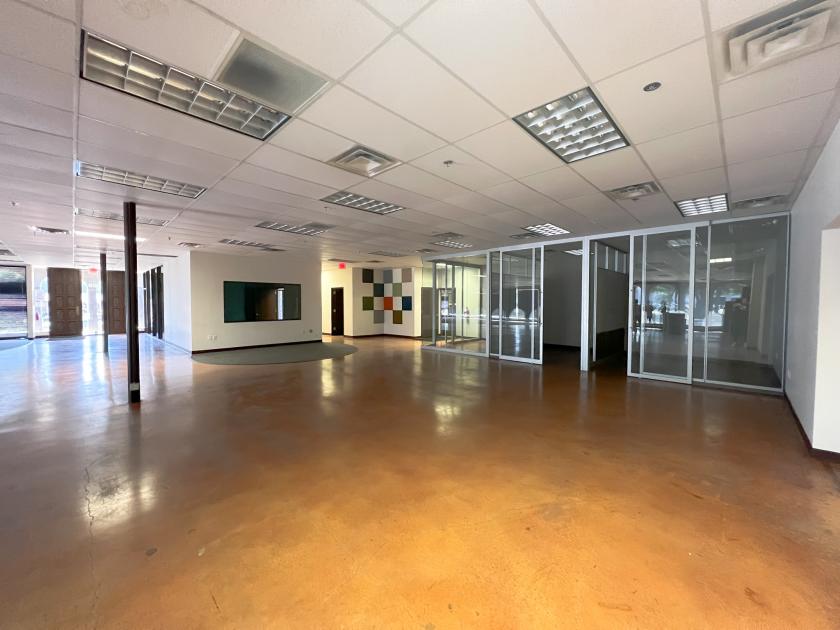
• Cubework goes above and beyond with IT support, living-room-style spaces, and the ability to build to suit your needs.
• Cubework offers industrial warehousing and office spaces built to suit individual tenants' needs.
Listing Agents

Josh Conde
O: 800-338-6369
josh.conde@cubework.com
O: 800-338-6369
josh.conde@cubework.com
While we strive to provide the most accurate information, all listing information, and demographic data, is provided by third-parties. As such, MyEListing will not be responsible for the accuracy of the information. It is strongly recommended that you verify all information with the listing agent, and any relevant agencies, prior to making any decisions.