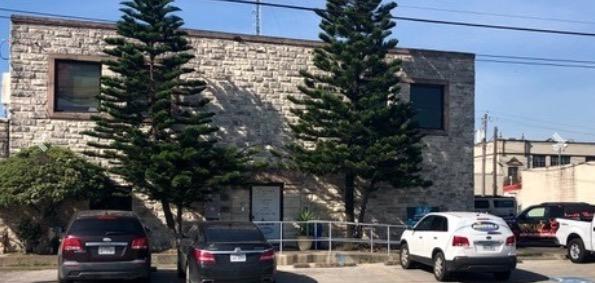
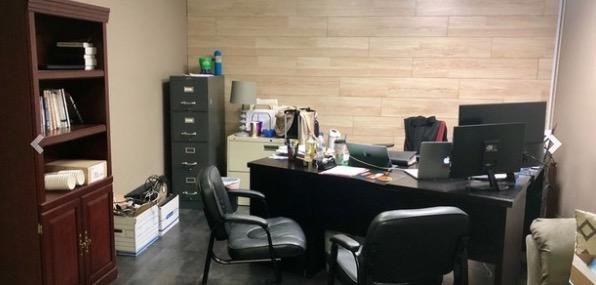
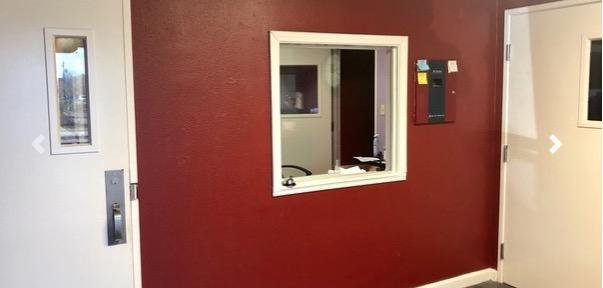
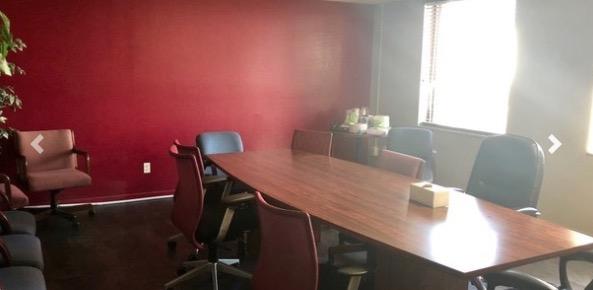
1-Mile | 3-Miles | 5-Miles | ||
---|---|---|---|---|
Total Population | 17,634 | 95,080 | 159,405 | |
Population Median Age | 39 | 38 | 38 | |
Population by Age | 0-9 Yrs | 2187 (12%) | 12501 (13%) | 21721 (13%) |
10-19 Yrs | 2426 (13%) | 13118 (13%) | 21496 (13%) | |
20-29 Yrs | 2224 (12%) | 12929 (13%) | 22610 (14%) | |
30-39 Yrs | 2317 (13%) | 12261 (12%) | 20686 (12%) | |
40-49 Yrs | 2313 (13%) | 11401 (11%) | 19502 (12%) | |
50-59 Yrs | 2295 (13%) | 12595 (13%) | 20078 (12%) | |
60-69 Yrs | 2111 (11%) | 10257 (10%) | 17507 (10%) | |
70+ Yrs | 1763 (9%) | 10017 (10%) | 15804 (9%) | |
Median HH Income | $37,042 | $38,708 | $43,656 | |
Total Household Income | < 24K | 2326 (35%) | 11041 (33%) | 16085 (28%) |
25-49K | 1740 (26%) | 9100 (27%) | 15143 (26%) | |
50-74K | 1023 (15%) | 5527 (16%) | 10011 (17%) | |
75-99K | 591 (8%) | 3033 (9%) | 6517 (11%) | |
100-199K | 723 (10%) | 3763 (11%) | 7214 (12%) | |
200K+ | 187 (2%) | 829 (2%) | 1482 (2%) | |
Highest Education Level | No Diploma | 3541 | 19508 | 26212 |
Diploma or GED | 3376 | 20094 | 33604 | |
Some College | 2112 | 11987 | 23496 | |
Assoc. Degree | 566 | 3527 | 6468 | |
Bachelors Degree | 1315 | 5024 | 9877 | |
Higher Degree | 947 | 3017 | 5581 | |
Total Housing Units | 7,779 | 38,406 | 63,816 | |
--Owner-Occupied | 3,331 | 18,073 | 31,178 | |
--Renter-Occupied | 3,259 | 15,220 | 25,275 | |
Owner-Occupied Values | < 100K | 2024 | 12662 | 17549 |
100-199K | 784 | 3688 | 10385 | |
200-299K | 225 | 741 | 1615 | |
300-399K | 95 | 251 | 524 | |
400-499K | 143 | 321 | 385 | |
500K+ | 61 | 409 | 721 | |
Total Working Age Population | 14,046 | 74,528 | 124,570 | |
In Work Force | 8,316 | 43,251 | 76,172 | |
Not In Work Force | 5,730 | 31,277 | 48,398 | |
Workforce Employed | 7,802 | 40,653 | 71,198 | |
Workforce Unemployed | 494 | 2,557 | 4,911 | |
Civlian Workforce | 8,296 | 43,210 | 76,109 | |
Military Workforce | 20 | 41 | 63 | |
Total Households | 6,590 | 33,293 | 56,453 | |
Family Households | 4,218 | 22,594 | 38,044 | |
Non-Family Households | 2,372 | 10,699 | 18,409 | |
Married Couple | 2,519 | 13,518 | 23,498 | |
Other Family | 1,700 | 9,076 | 14,546 | |
Married w/Child | 881 | 5,095 | 8,852 | |
Single Male w/Child | 94 | 760 | 1,477 | |
Single Female w/Child | 750 | 3,199 | 5,357 |
Population Change Last Two Decades - Plus Projection
2000 | % | 2010 | % | 2020 | % | 2030 | |
---|---|---|---|---|---|---|---|
Texas | 20,851,820 | +21 | 25,145,561 | +18 | 29,677,668 | +18 | 34,894,452 |
Nueces County | 313,645 | +8 | 340,223 | +13 | 383,718 | +12 | 429,517 |
Total Working Age Population:
Total Households:
Total Working Age Population:
Total Households:
Total Working Age Population:
Total Households: