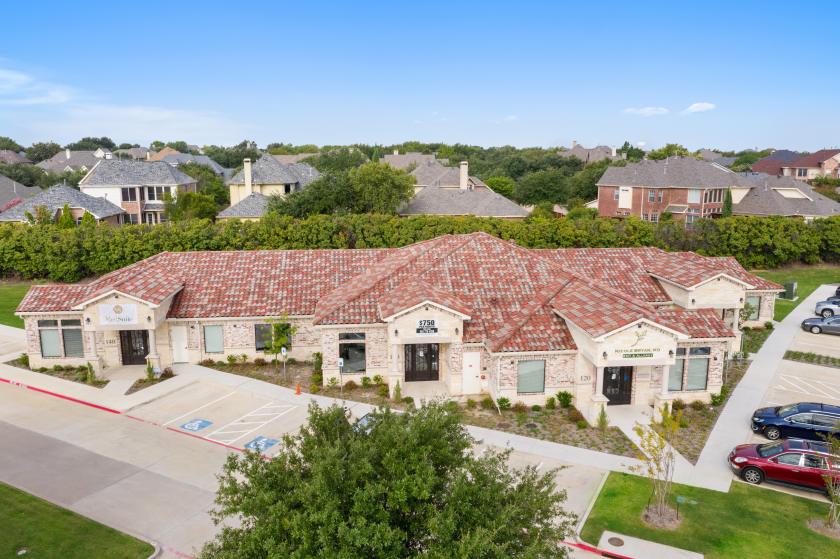
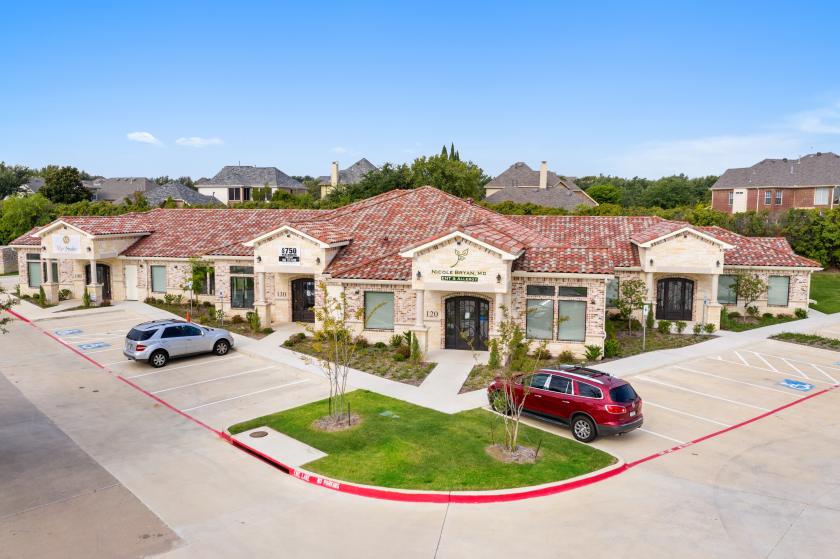
Office Space
1790 King Arthur Boulevard The Colony, TX 75056
1790 King Arthur Boulevard The Colony, TX 75056

Details & Description
Property Highlights
• Located on one of the main entrances to the award wining Castle Hills master plan development in Carrollton, Texas
• Nearby schools include Arbor Creek Middle School, Indian Creek Elementary School, Castle Hills Elementary School
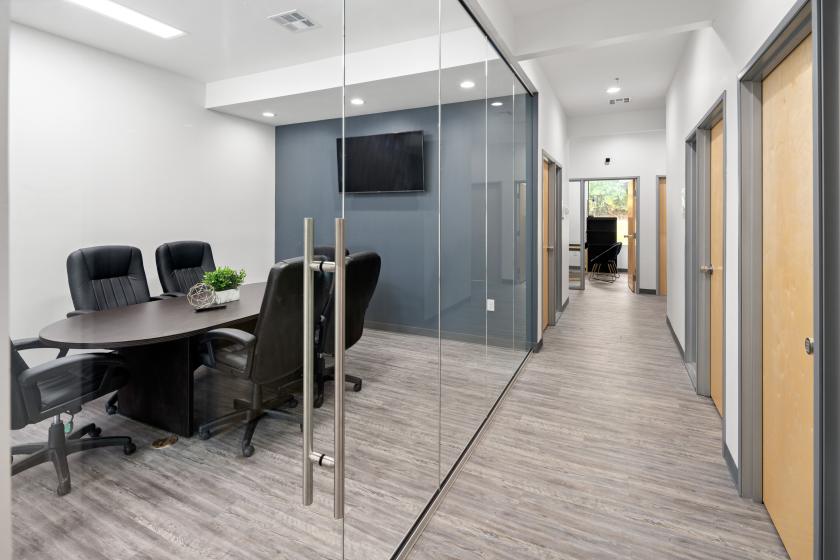
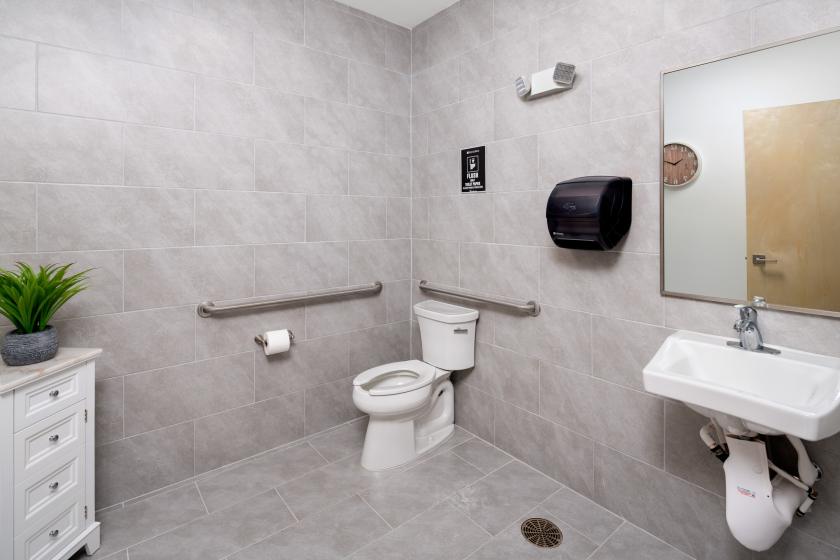
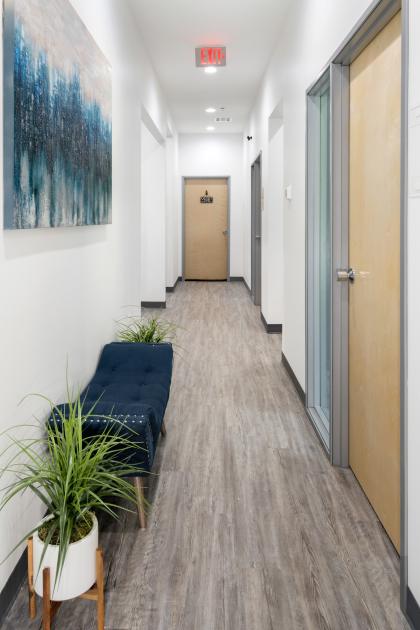
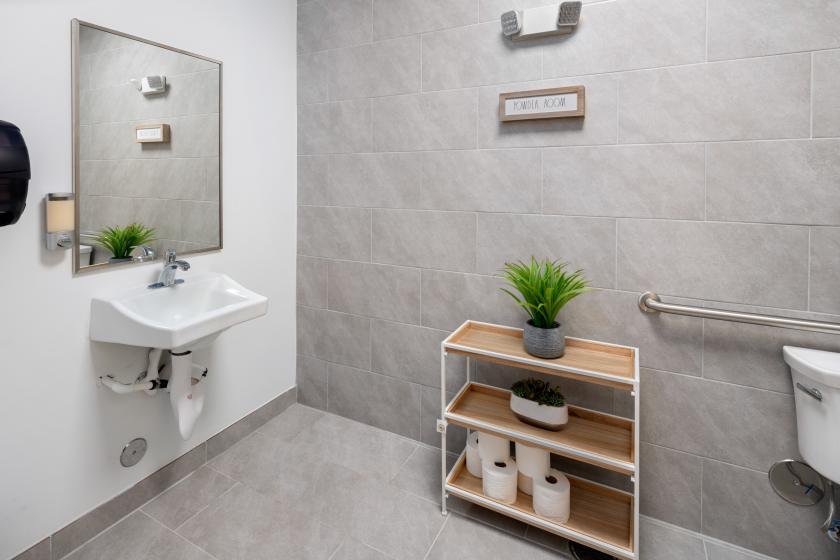
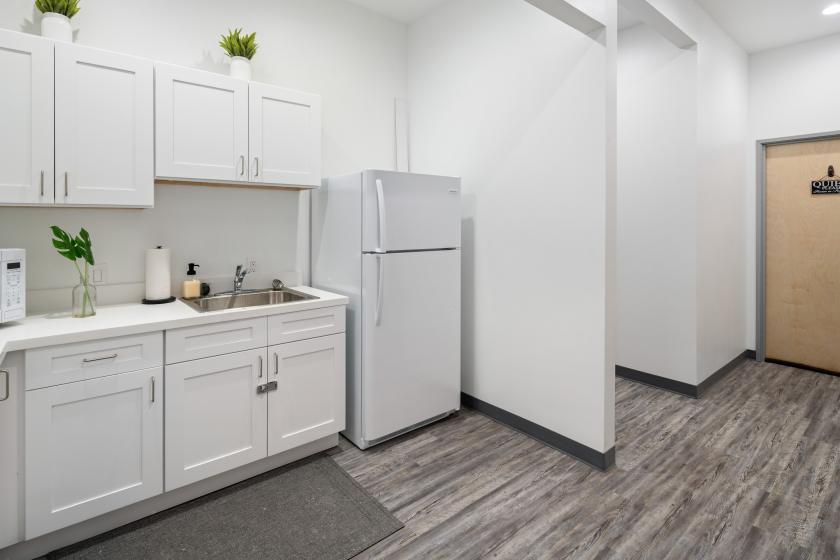
Additional Photos

Listing Agents

Ravi Polishetty
O: 903-776-4350
sales@leezaspace.com
O: 903-776-4350
sales@leezaspace.com
While we strive to provide the most accurate information, all listing information, and demographic data, is provided by third-parties. As such, MyEListing will not be responsible for the accuracy of the information. It is strongly recommended that you verify all information with the listing agent, and any relevant agencies, prior to making any decisions.