Office Space
4323 North Josey Lane Carrollton, TX 75010
4323 North Josey Lane Carrollton, TX 75010
Details & Description
Property Highlights
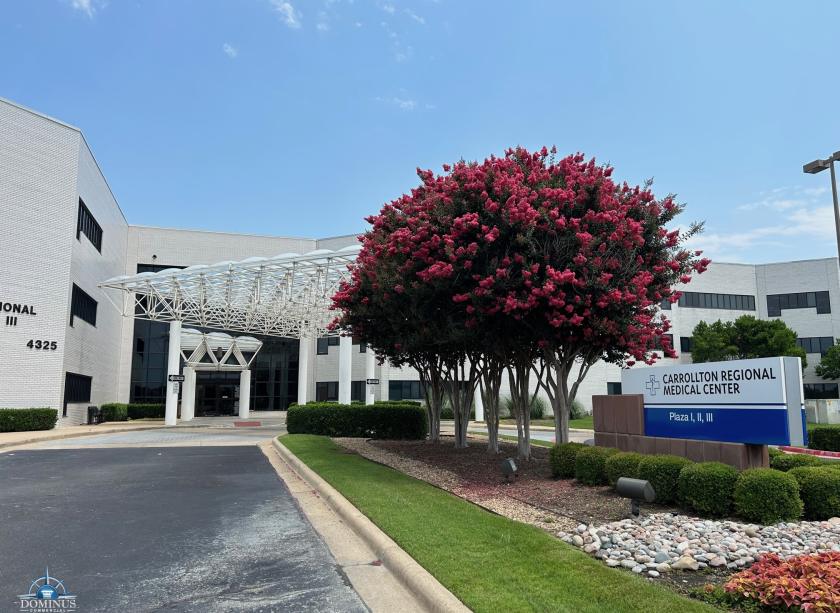
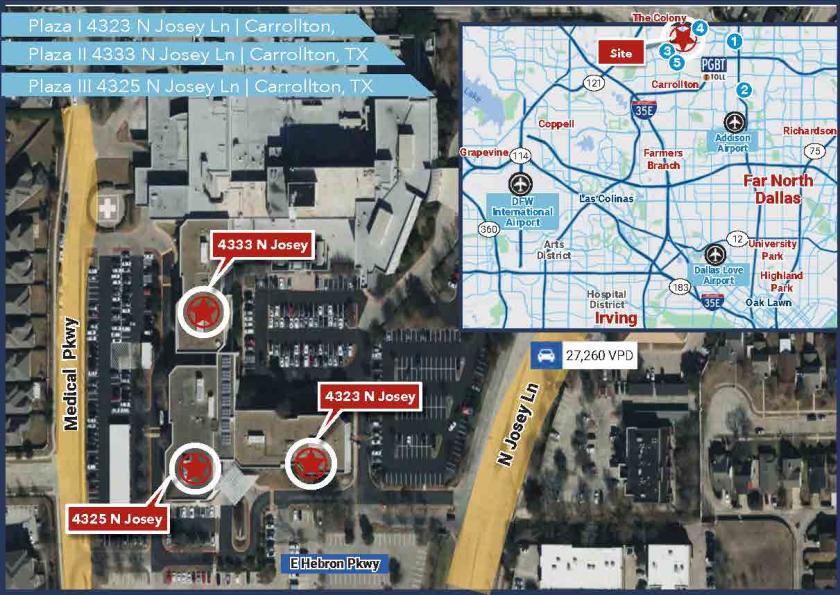
• Located near the NW intersection of Josey Lane & Hebron Pkwy and surrounded by dense residential neighborhoods
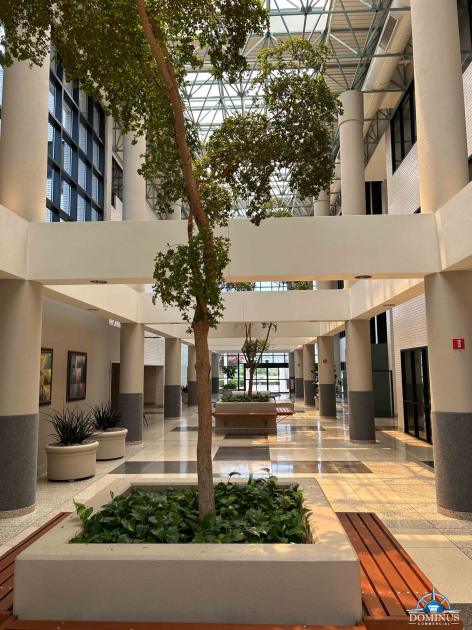
• First Class Medical Space with Move-in ready suites and recently remodeled common areas
Additional Photos


Listing Agents

Blake LeGrow
O: 214-253-0786
blegrow@dominuscommercial.com
O: 214-253-0786
blegrow@dominuscommercial.com

Justin Owen
O: 214-253-0797
jowen@dominuscommercial.com
O: 214-253-0797
jowen@dominuscommercial.com
While we strive to provide the most accurate information, all listing information, and demographic data, is provided by third-parties. As such, MyEListing will not be responsible for the accuracy of the information. It is strongly recommended that you verify all information with the listing agent, and any relevant agencies, prior to making any decisions.


