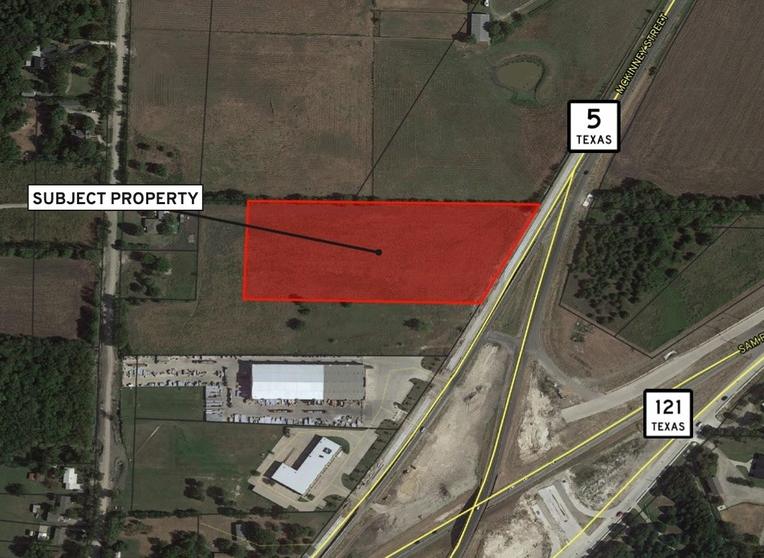
Commercial Land
N From McKinney St on Hwy 5 Melissa, TX 75454
N From McKinney St on Hwy 5 Melissa, TX 75454
Details & Description
Property Highlights
- • Buildable Acres: 6
- • Zoning: AG - Agricultural
- • Available Utilities: Nearby
- • Frontage: 382' on TX HWY 5
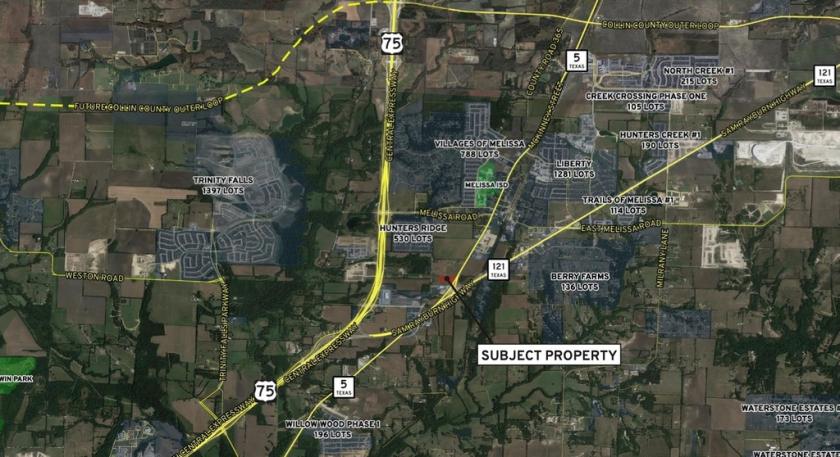
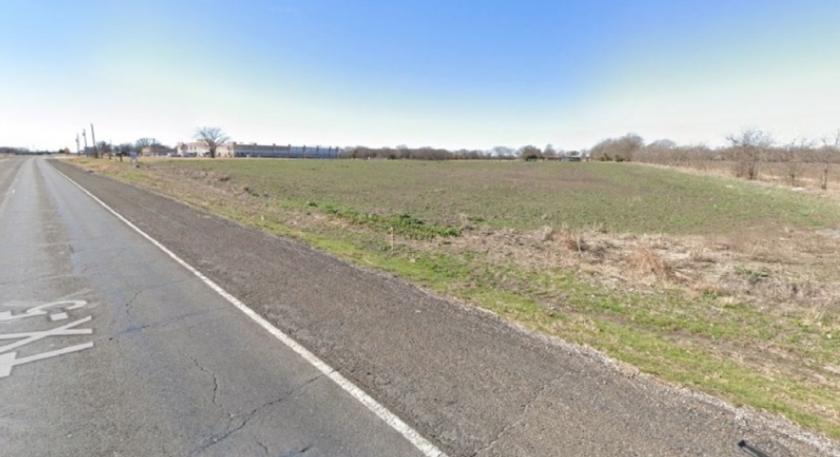
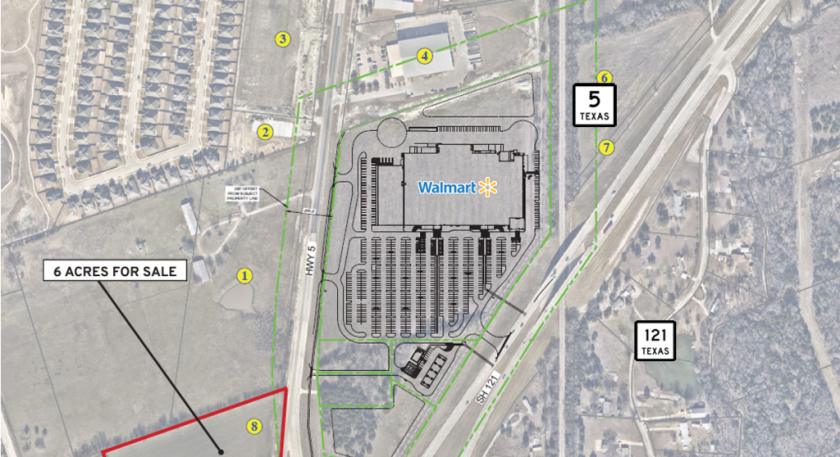
Additional Photos
Listing Agents

David Cox
O: 972-632-5050
M: 972-333-3900
dcox@careycoxcompany.com
O: 972-632-5050
M: 972-333-3900
dcox@careycoxcompany.com
While we strive to provide the most accurate information, all listing information, and demographic data, is provided by third-parties. As such, MyEListing will not be responsible for the accuracy of the information. It is strongly recommended that you verify all information with the listing agent, and any relevant agencies, prior to making any decisions.


